Research &
Problem Framing
With an annual target of 10,000 turbine reports on the table, the existing operating model couldn't keep up — not on speed, not on cost. I mapped the entire blade inspection workflow and framed the core problem around the biggest bottleneck: defect marking. This research became the starting point for Zoomable Worker and Zoomable Wind.
Why This Mattered
Before designing the screens,
we had to understand the operating model.
A wind blade inspection report passes through many hands — QC, defect marking, defect decision, and report generation. In 2022, one report cost about KRW 100,000 to produce, and the gap from final capture to customer delivery was two weeks. That structure couldn't process 10,000 turbines a year.
Polishing the UI wasn't going to solve this. Before any of that, we had to map structurally where time was being burned, which steps were people-dependent, and why quality stayed inconsistent.
This project was the starting point of the product strategy. Before any screen design, the goal was to define operational bottlenecks and draw a clean line between where automation can step in and where human judgment has to stay.
Research Methods
Four research methods,
stacked to read the problem in layers.
These methods weren't independent. They ran as one sequence — operating reality → field problem collection → process bottleneck identification → quantitative validation.
Desk Research
Surveyed the operating model, defect detection methods, and report generation flow in the wind blade inspection industry. Compared standard industry workflow to the company's system and located where structural improvement was possible.
→ Full structure and cost shape of the report production pipeline
Stakeholder Interview
Conducted in-depth interviews with four roles in the inspection workflow — technicians, field engineers, supervisors, and data analysts. Identified which tasks burned time and where trust broke per role.
→ Six structural pain points recurring across roles
Workflow Analysis
Mapped the full AS-IS process: capture complete → image upload → Quality Check → Defect Marking → Defect Decision → Report. Recorded dependencies, wait times, and people-dependence per step to surface the bottlenecks.
→ QC wait time and DM people-dependence confirmed as core bottlenecks
Quantitative Review
Ran quantitative analysis across 100 turbines and 5 operators — image count, work time, defect count, severity distribution. Compared DM and QDM (Quick Defect Marking) to verify the real impact of automation.
→ Confirmed 56.5% reduction in images and 55.7% reduction in work time
In-Depth Interview
Field interviews across four roles
surfaced the recurring structural problems.
We interviewed technicians, field engineers, supervisors, and data analysts on the wind blade inspection workflow. The goal: identify the operational problems that repeat across roles — not individual complaints.

“Lots of duplicate images, so the work takes forever. Defect labeling isn't consistent, so corrections happen all the time.”
Goal: Identify and repair blade defects fast to minimize downtime.
“I have to finish quality checks fast after uploading images, but the process takes too long. Real-time communication is rough — sharing progress is a pain.”
Goal: Inspect and report defects fast from the field so response is quick.
“The defect management process is inefficient. PPA-detected defects often need a second pass. Data cleanup takes a lot of time and real-time communication is missing.”
Goal: Run the whole defect management process efficiently and keep operations stable.
“Defect data isn't consistent, so cleaning the metadata takes a huge amount of time. Writing accurate reports needs extra rounds of review.”
Goal: Analyze defect data, produce reports, and deliver them to the operations team.
Six structural problems that repeat across roles
Duplicate image overload— Duplicate captures of the same area flow into the work queue without filtering, inflating the review load.
Inconsistent defect marking— Defect type and severity criteria vary across operators, triggering repeated corrections and re-reviews.
Image QC delay— QC completion can take up to 48 hours, and that wait is tied to the pilot demobilization schedule.
Low trust in PPA— AI-detected defect accuracy is low, so manual re-review is mandatory and system trust stays low.
Metadata cleanup burden— Defect data inconsistency forces data analysts to spend excessive time on manual cleanup before report writing.
No real-time collaboration— No real-time channel between roles means work status sharing lags, and weekends or absences stall the process.
Key Findings
From AS-IS to TO-BE —
the structural opportunity for process transformation.
This isn't just '48 hours dropped to 2.' The real constraints on scale were structural: QC wait time dictating the pilot demobilization schedule, and DM/DD needing headcount proportional to volume.
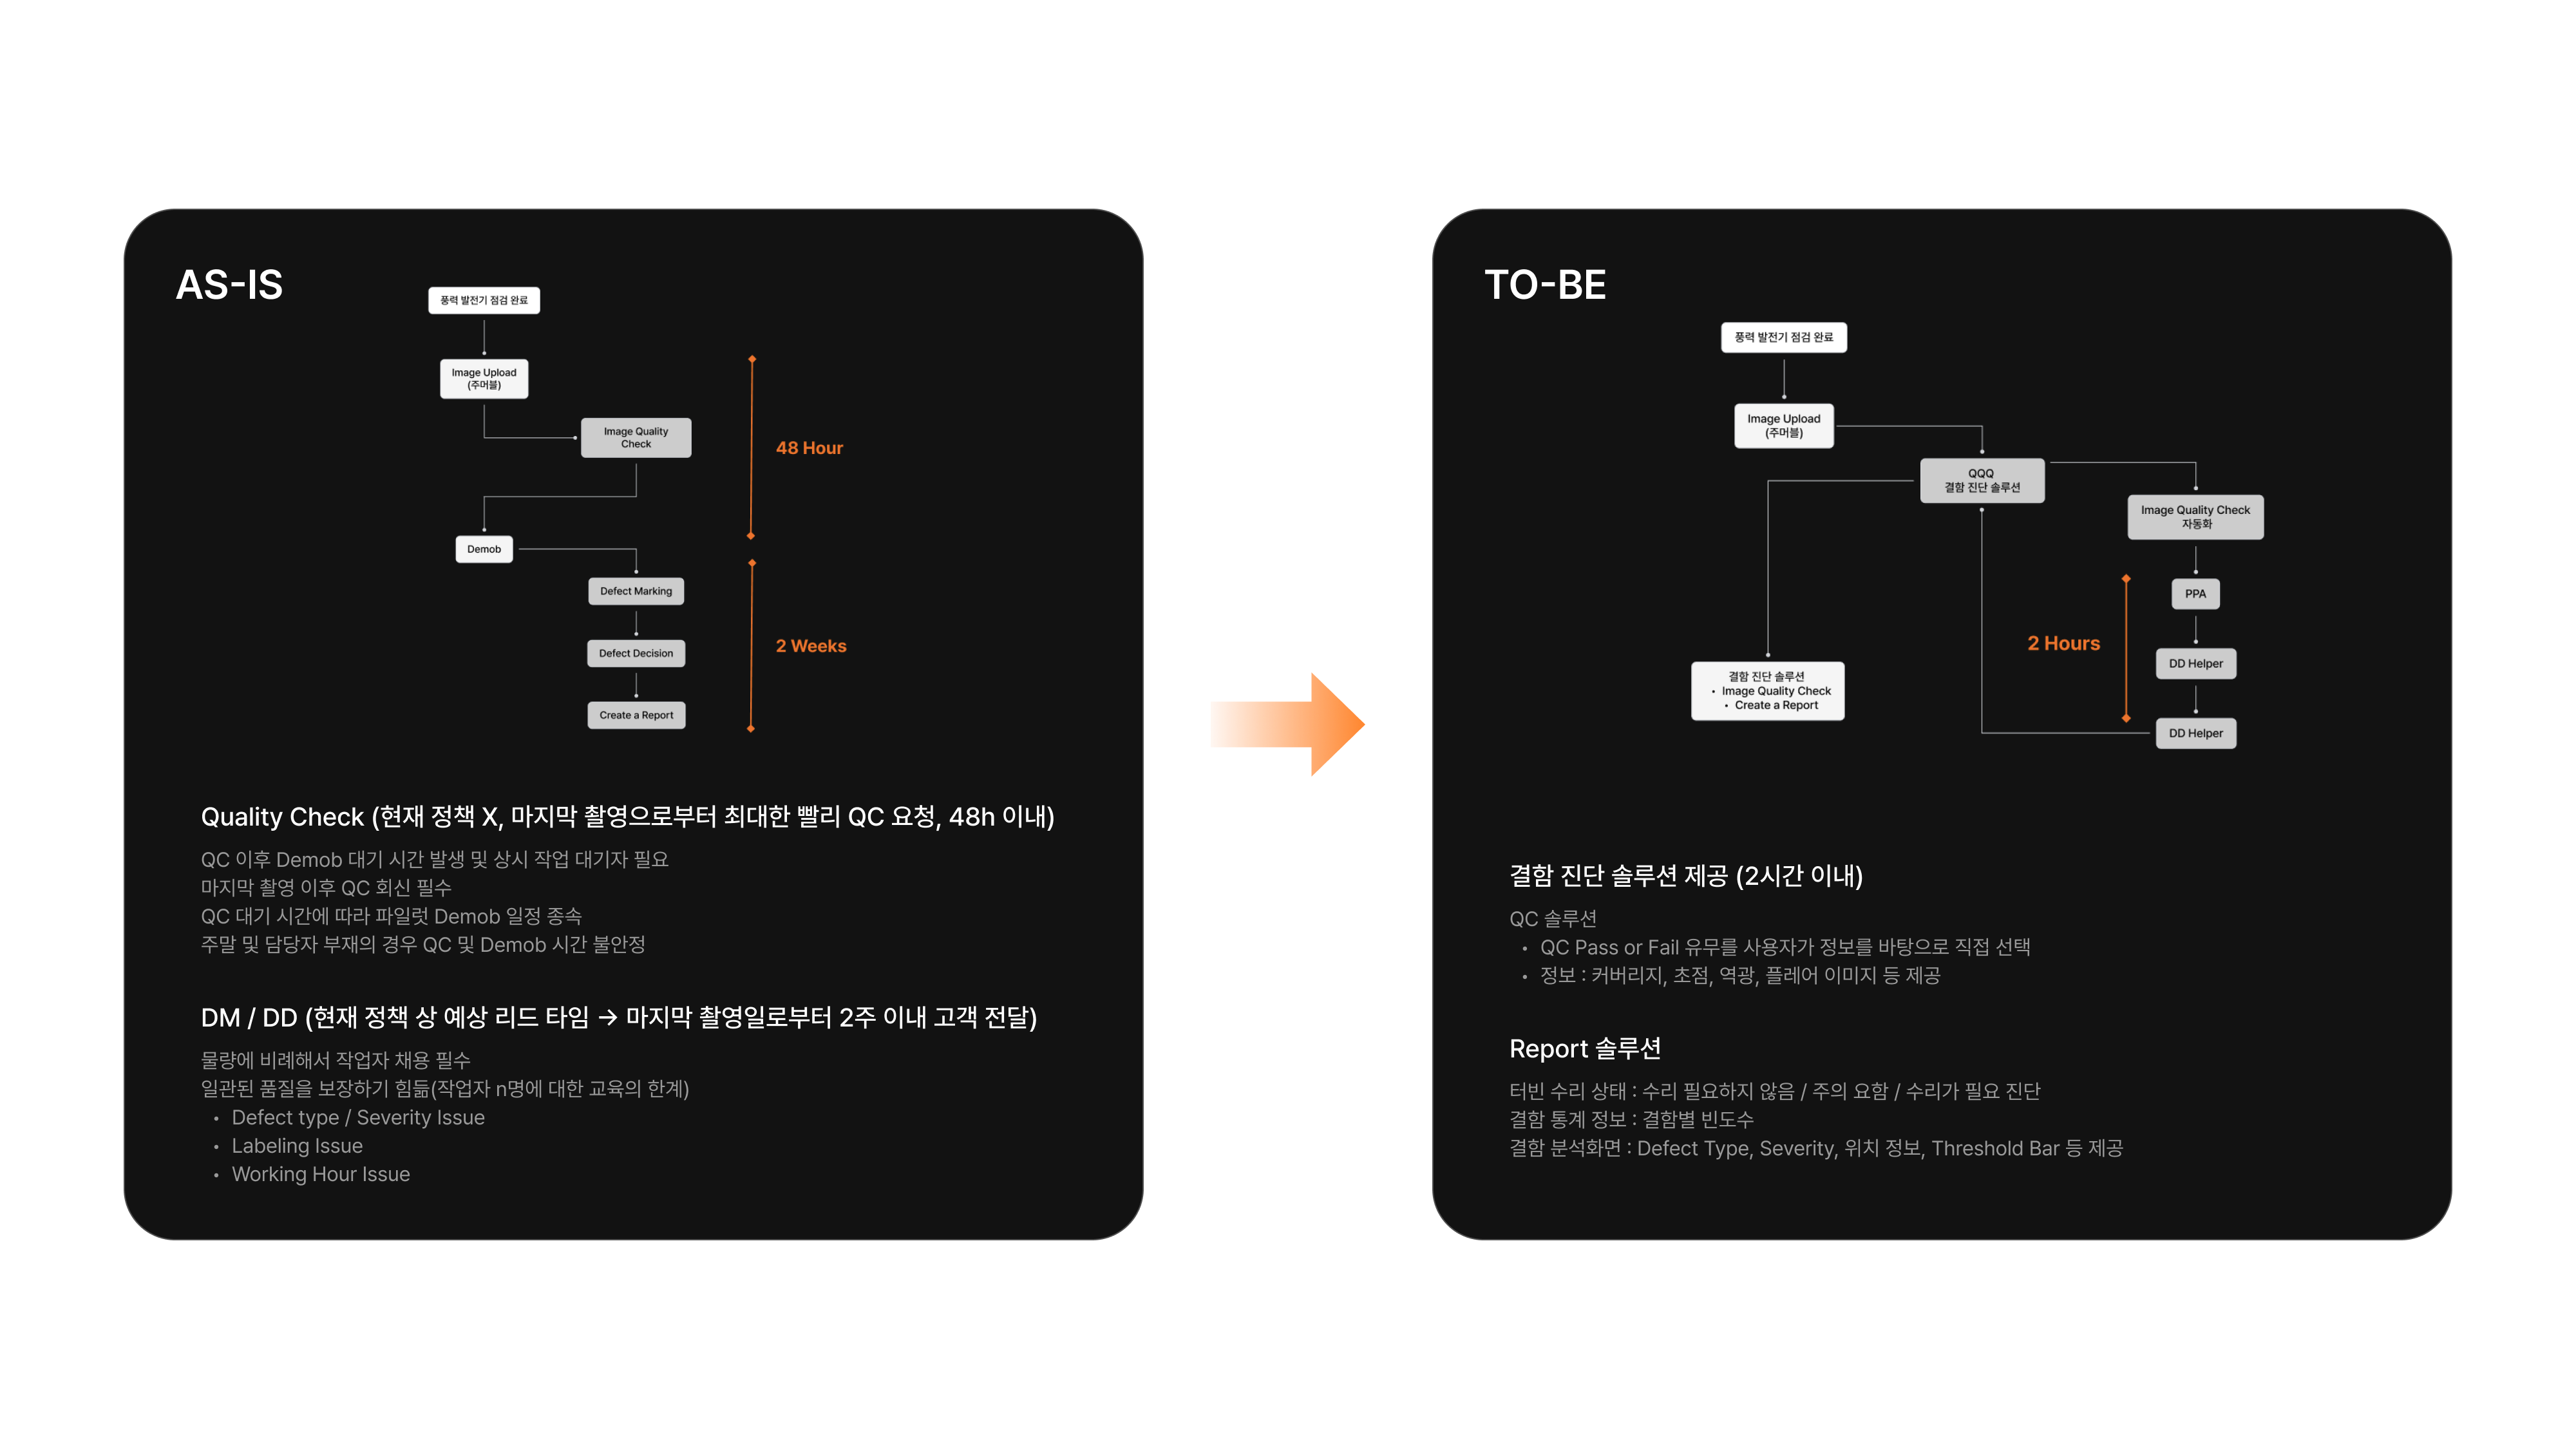
The point wasn't time saved. The three structural problems at the process level were: QC waiting dictates the field schedule, DM can only scale with people, and labeling quality depends on operator experience. That's why we had to change the operating architecture, not the UI.
Problem Framing
Translating identified problems
into four design challenges.
The operational problems from interviews and workflow analysis got structured into a form product design could respond to. Each challenge follows: problem → why it matters → design response.
Remove duplicate images
Duplicate captures of the same area enter the work queue without filtering. Operators end up reviewing redundant images.
Of the average 435 images per turbine, a large share are duplicates. They are the direct driver of review load — over half of work time burns there.
→ AI-based automatic duplicate image filtering.
Improve defect marking
B-box editing is cumbersome and marking criteria vary across operators. Even within one report, calls drift.
Labeling and severity inconsistency triggers repeated review and correction. Quality variance widens as headcount grows.
→ Improve B-box editing UX and systematize the marking guideline.
Improve PPA trust
Low trust in PPA's auto defect detection — operators routinely ignore AI output and re-do detection by hand.
If system trust stays low, automation's time savings disappear. Reducing false positives and making results interpretable are prerequisites.
→ Improve AI model performance, reduce FP, automate defect classification.
Strengthen collaboration
No real-time channels between roles means status sharing lags. Weekends and absences stall the whole workflow.
Without QC completion notifications, defect comments, and status sharing, people's availability still governs process speed.
→ Real-time notifications, comments, and a work status dashboard.
Proposed Operating Model
What to automate,
what to leave to human judgment.
QC and first-pass defect detection run as an AI pipeline. Final defect decisions and customer-specific work stay with experienced operators. We designed the automation boundary at the operating-structure level.
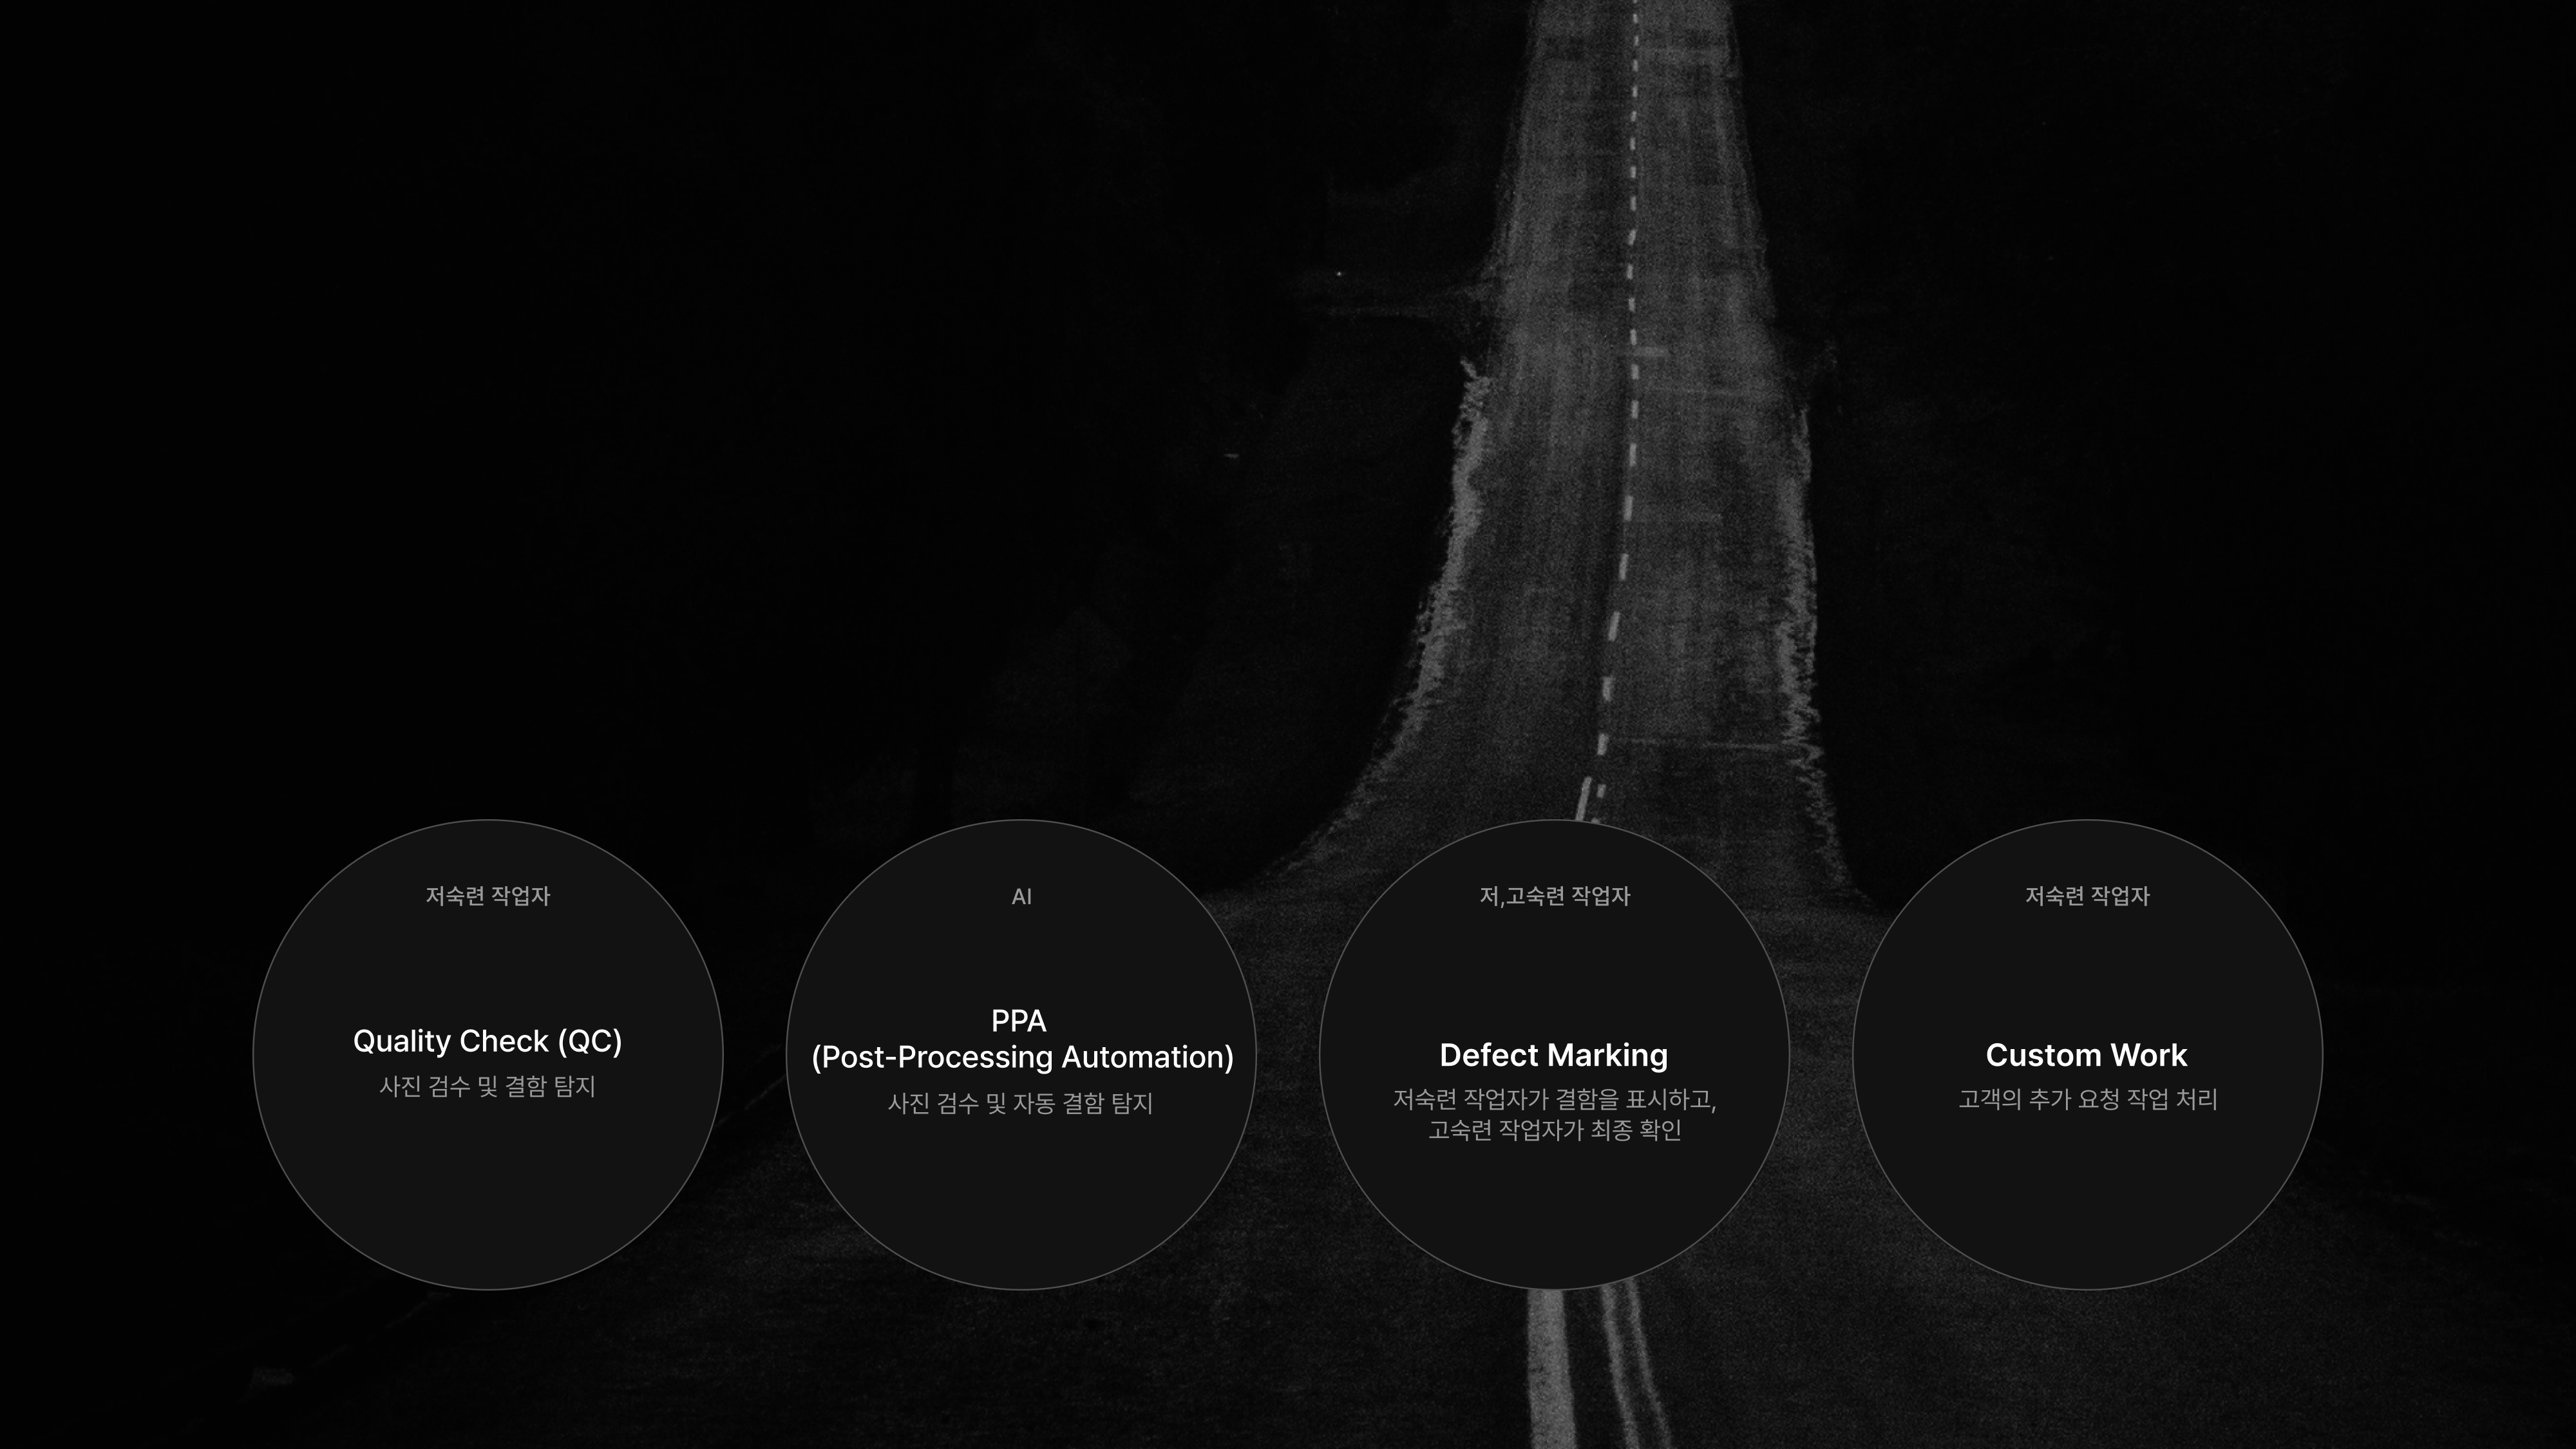
Image quality check (QC), duplicate filtering, first-pass defect detection (PPA), automatic defect type and position classification.
Final defect decision, severity confirmation, customer-specific custom work.
Lead time 2 weeks → 2 hours, people-dependence released, quality held even as volume grows.
What automation replaces
First-pass defect diagnosis without human intervention
QC and PPA run as an AI pipeline. Includes duplicate filtering, coverage verification, focus and backlight detection, defect position and type auto-classification.
Where human judgment stays
Layer human accuracy on top of automation speed
Final defect decisions and customer-specific work stay with experienced operators. They review and edit the first-pass results AI provides.
Role redistribution
Automation absorbs low-skill work; high-skill focuses on judgment
Pre-QC and pre-DM low-skill work moves to automation. High-skill operators focus on final review and customer-facing work.
Operating structure shift
Volume growth no longer requires headcount growth
A two-week process compresses to under two hours. Standby coverage becomes unnecessary, and the pipeline keeps moving on weekends and absences.
Quantitative Results
Quantitative validation
confirmed the design direction was sound.
Through the third QDM test and 2022→2023 year-over-year growth metrics, we verified that duplicate removal and PPA performance improvements translated into real operational impact.
Quantitative Results Comparison
435 images → 189 images
Duplicate removal cuts the reviewable set in half. Review load drops structurally.
79 min → 35 min
The same team processes more turbines. The basis for scaling without hiring.
KRW 100,943 → KRW 15,059
Per-report cost down to ~1/7. The budget structure holds even at 10,000 turbines.
KRW 50M → KRW 134M
Production cost down 60% while revenue rose 168%. Operating margin moved from a loss to KRW 109M.
On quality, coverage of severity-3+ defects clears 94%. Precision 13.4 and Recall 50.9 show automation can't close it alone — but in terms of catching high-risk defects, the result confirms the design direction of combining auto detection with human final review. Holding the 2022 method, the 2024 report budget would have needed ~KRW 1.3B. PPA brought it down to ~KRW 280M — a 78.36% reduction.
Performance Metrics
DM vs QDM performance comparison
Comparing the core metrics of the existing Defect Marking method and the Quick Defect Marking method. Image count and work time both dropped more than half, while severity-3+ defect coverage held above 94%.
Work time and image count
Average Lead Time Comparison
Work time (Production vs QDM Test)
Average Image Count Comparison
Image count (Production vs QDM Test)
Defect distribution
Average Production Defects
Defect distribution (Production)
Average Counts of Test Defects
Defect distribution (QDM Test)
| Metric (average) | DM (Defect Marking) | QDM (Quick Defect Marking) | Change |
|---|---|---|---|
| Image count | 435 images | 189 images | 56.5% reduction |
| Work time | 79 min | 35 min | 55.7% reduction |
| Defect count | 56 | 66 | 94% severity-3+ coverage |
Connected Outcomes
From the problem structure this research defined,
two product tracks launched.
Research & Problem Framing isn't a one-off research project. It's the shared problem definition and design premise for two execution projects that came after it. The execution layer on the inspection field, and the management layer on the data side — both tracks start from the same research.
Zoomable Worker
The execution workflow platform for field inspection and defect marking. Built to directly resolve the duplicate image overload, defect marking inconsistency, and PPA trust gap problems this research surfaced.
- AI-based automatic duplicate image filtering
- Improved defect marking UX and B-box editing
- Better PPA reliability and reduced false positives
- 55% reduction in work time via QDM
Zoomable Wind
The operational visibility platform for managing and analyzing inspection data in the cloud. Built to resolve the metadata inconsistency, missing collaboration, and data cleanup burden problems this research surfaced.
- Auto-consistent defect data
- Real-time notifications and cross-role collaboration
- Cloud-based report management and analysis
- Operations-wide visibility and traceability