UX/UI Design · 2022–2024
Zoomable Wind
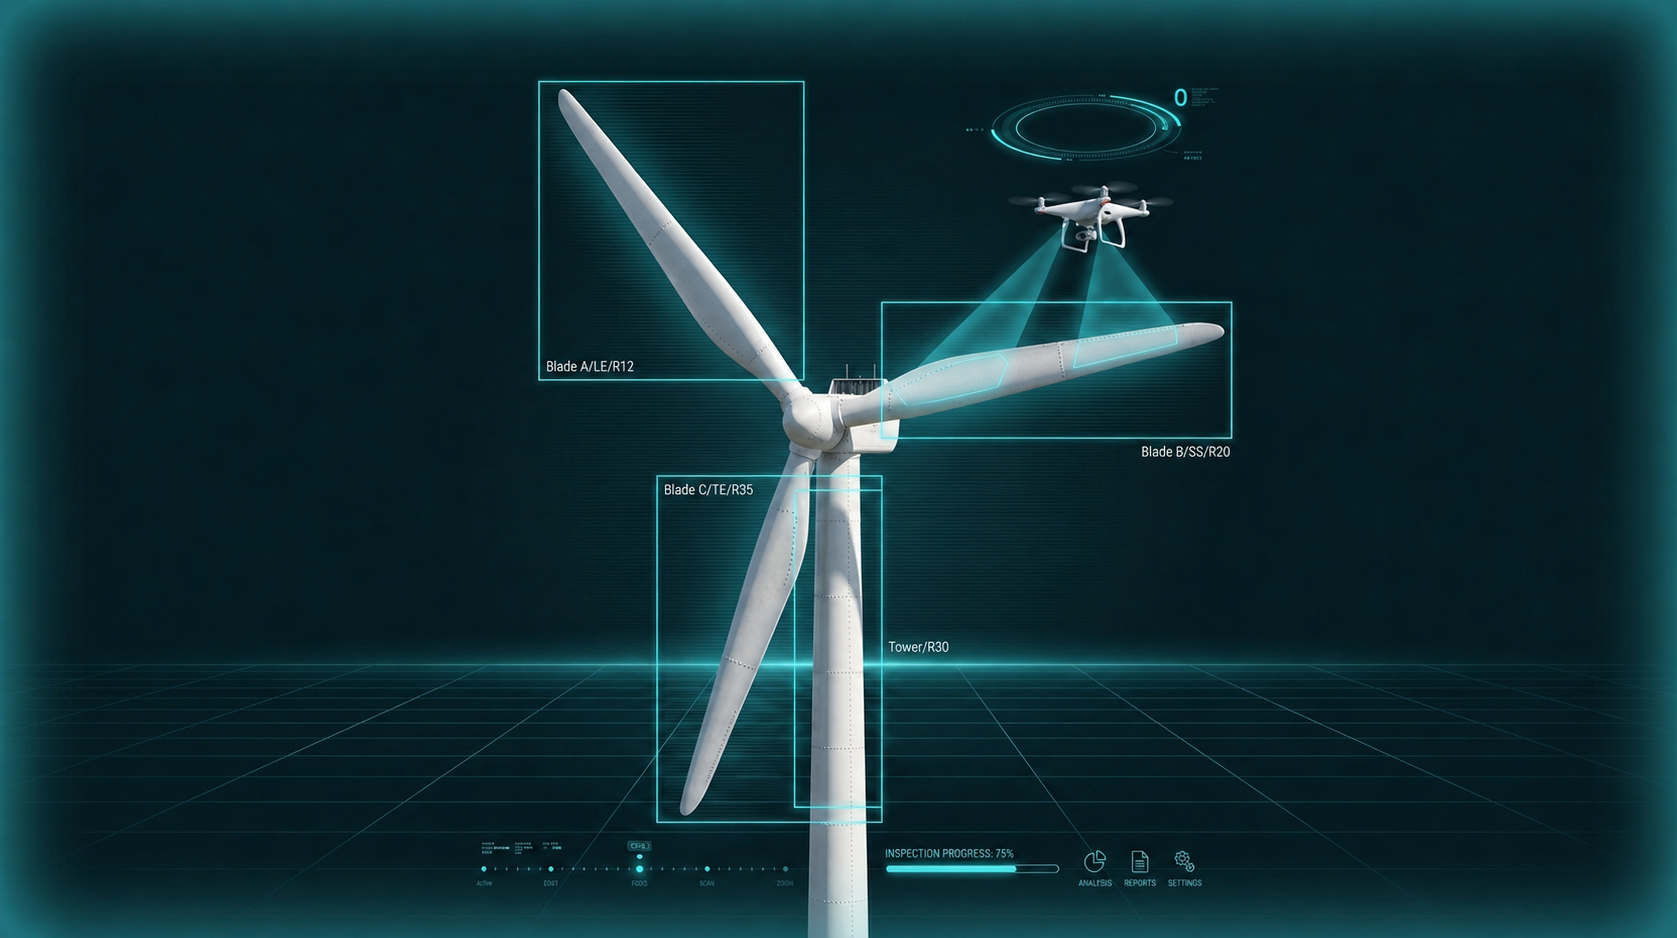
Cloud-based digital platform for managing and analyzing wind turbine inspection data captured by drones. From ultra-high-resolution defect identification through statistical analysis, reporting, history tracking, and repair management — one system for the full inspection operation.
Key insights surfaced in the research
The limits of photo-first browsing
Customers were burning through hundreds of photos hunting for defects. The same ask kept surfacing: 'just let me see the defects.'
Workflow broken after inspection
After data review, repair planning, assignment, and tracking lived in separate systems. Information dropped and stalled in transit.
No history-driven decisions
No way to compare past inspections with the current state. Reading defect progression or setting maintenance priority was effectively guessing.
From these findings, Zoomable Wind was scoped as a defect-centric analytics and operations platform — not another photo viewer.
Overview
Ultra-high-resolution photo-based
wind turbine defect management
Zoomable Wind is one of Nearthlab's digital solutions — a cloud-based database that effectively manages data captured by autonomous drones. Users identify defects by severity and position from ultra-high-resolution imagery, and the captured inspection data converts into analytical reports.
It's built around six core modules — Blades, Defects, Statistics, Reports, History, Management — covering inspection data collection, analysis, reporting, history management, and the repair process. The full operational workflow, on one platform.
Product Structure
End-to-end inspection data flow
Zoomable Wind structures the full inspection process into six function modules. Each runs independently, but data flows naturally between them.
Blades
Blade image review and defect position identification
Defects
Defect list filtering and detail review
Statistics
Statistical analysis and comparison by severity and type
Reports
Turbine and custom report generation and download
History
History tracking — read defect progression and forecast
Management
Project- and task-based repair process management
Core Feature 01
Blades
Designed so inspectors can scan defects at a glance — each inspected blade comes with a representative system-selected image. Three sub-modes — Blade Summary, Blade View, Gallery View — let users explore at different depths depending on the task.
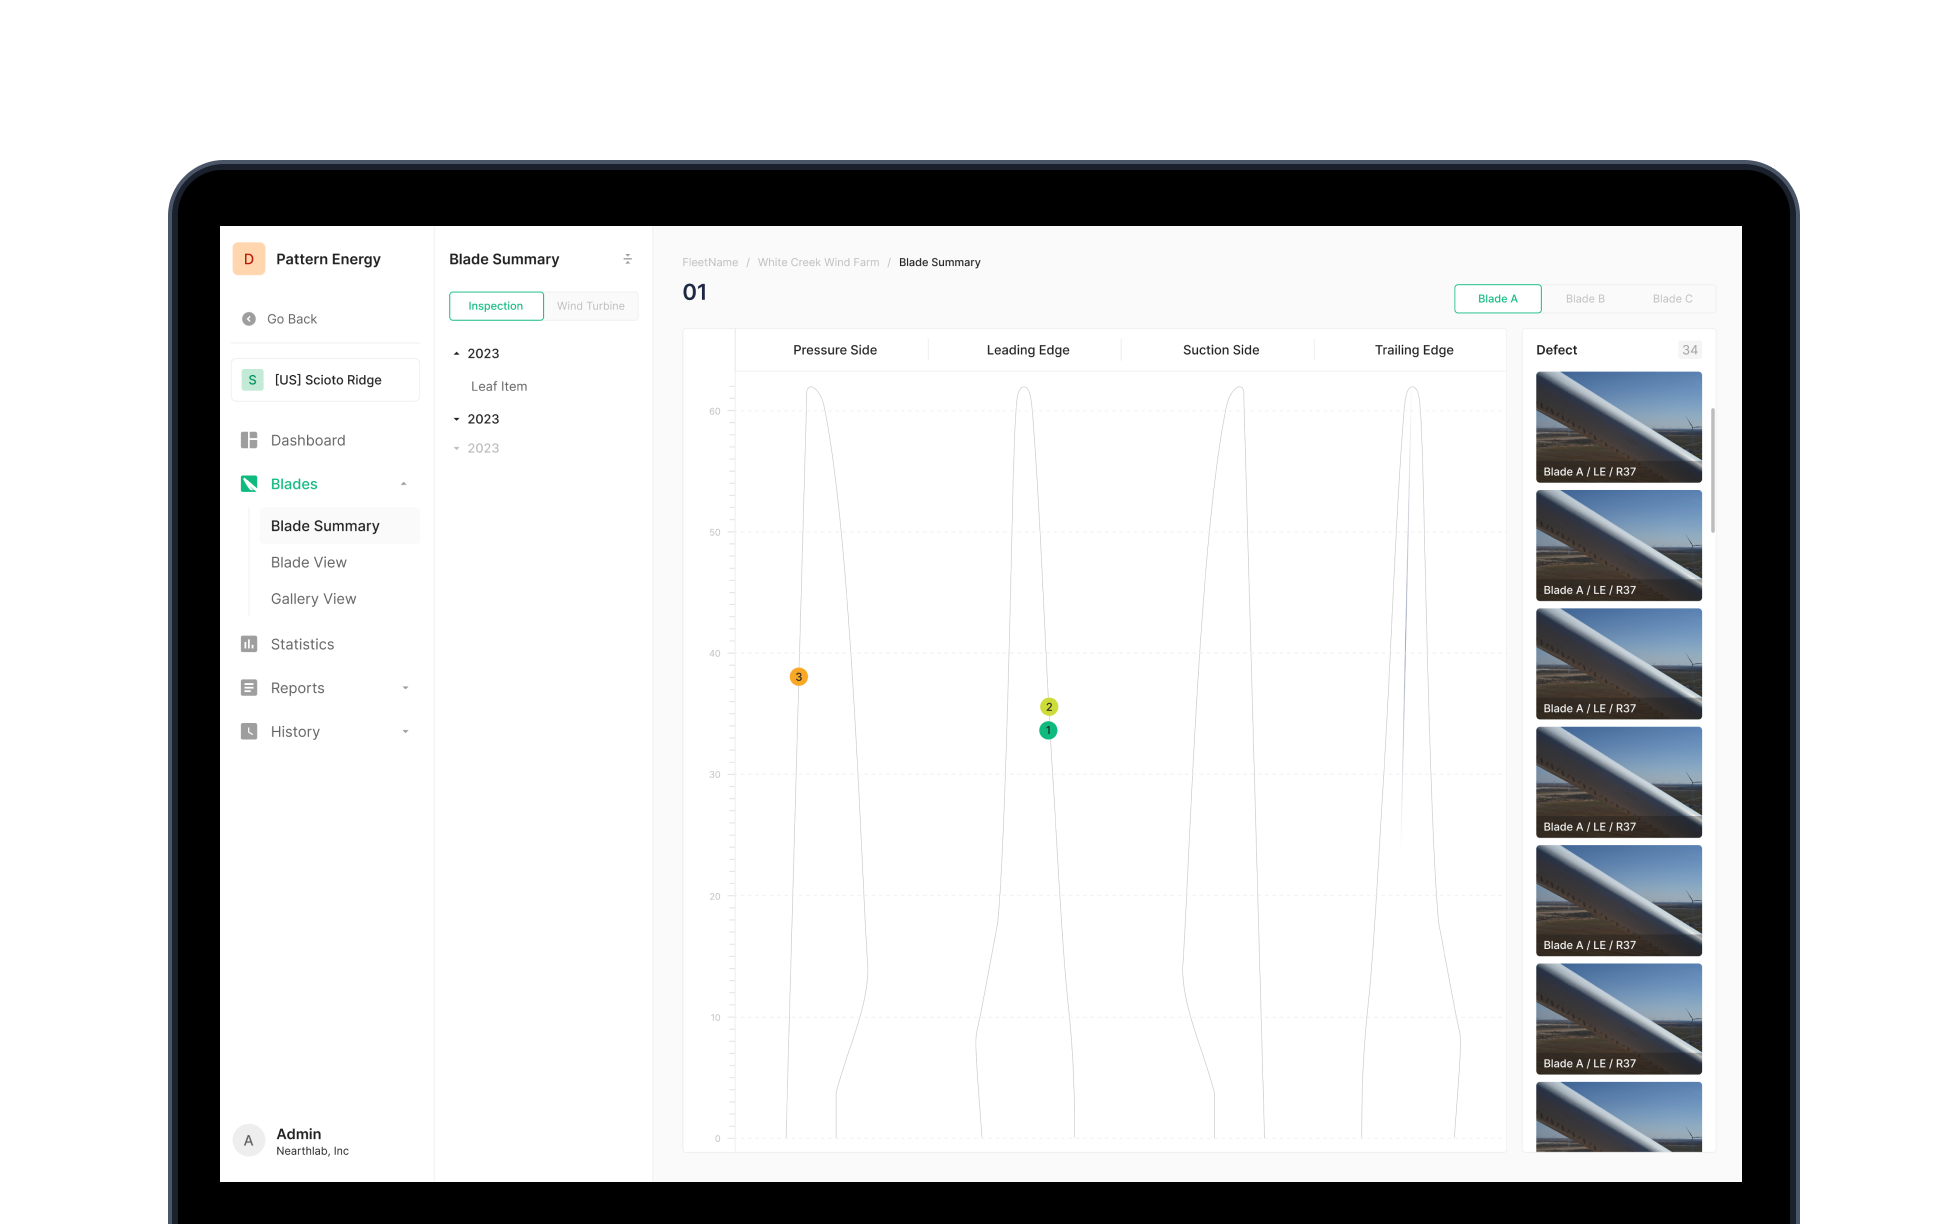
Blade Summary
The entry point that summarizes per-turbine defect information. Defect positions sit marked on the blade diagram — click to jump straight to the photo. Comes with defect add/edit tools, image editing, defect list, and status check.
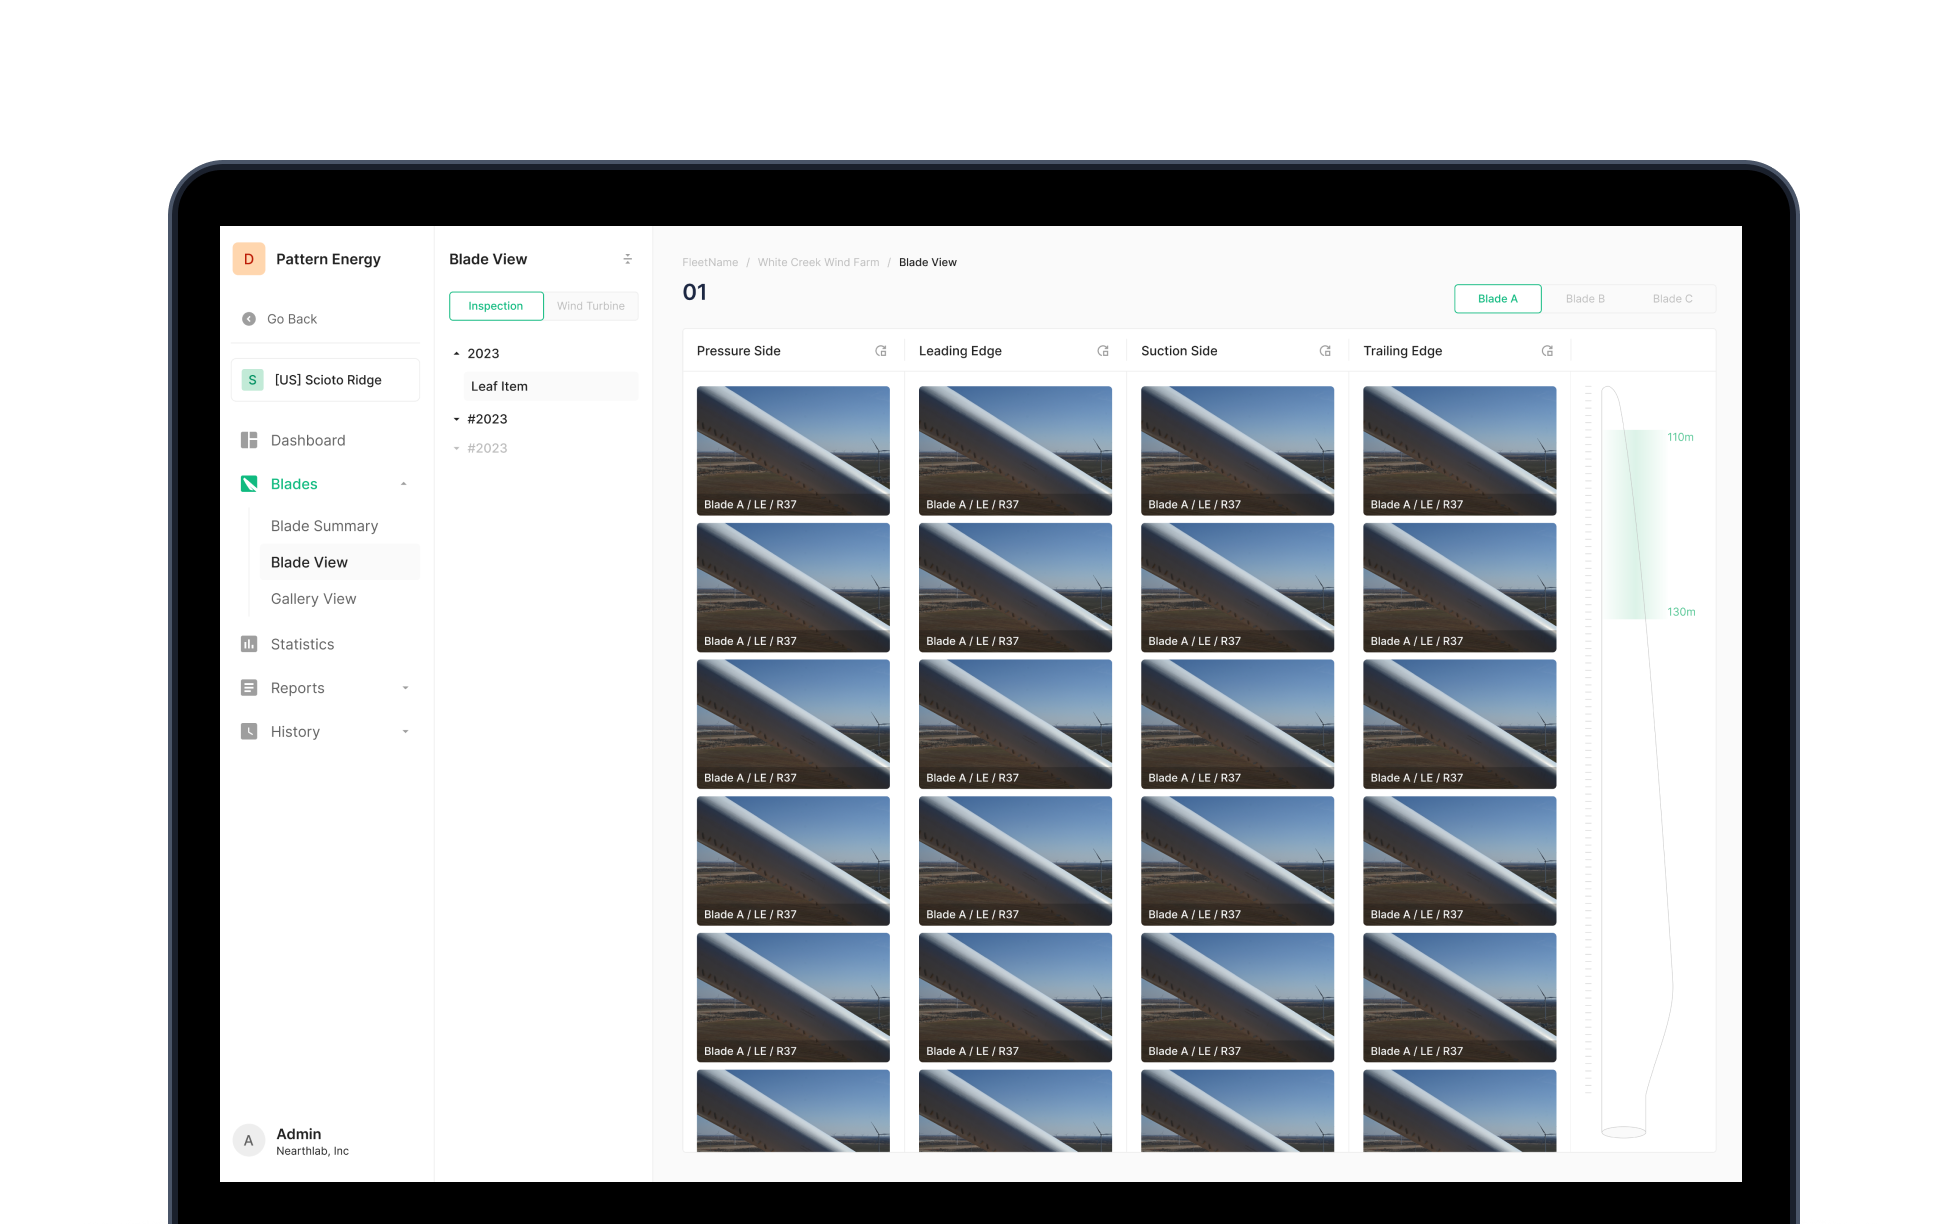
Blade View
The mode for reviewing every photo of a specific blade at once. Pick the inspection or turbine, switch between blades A/B/C, read defect count and severity, and use rotate/zoom plus adjacent-photo browsing for detailed review.
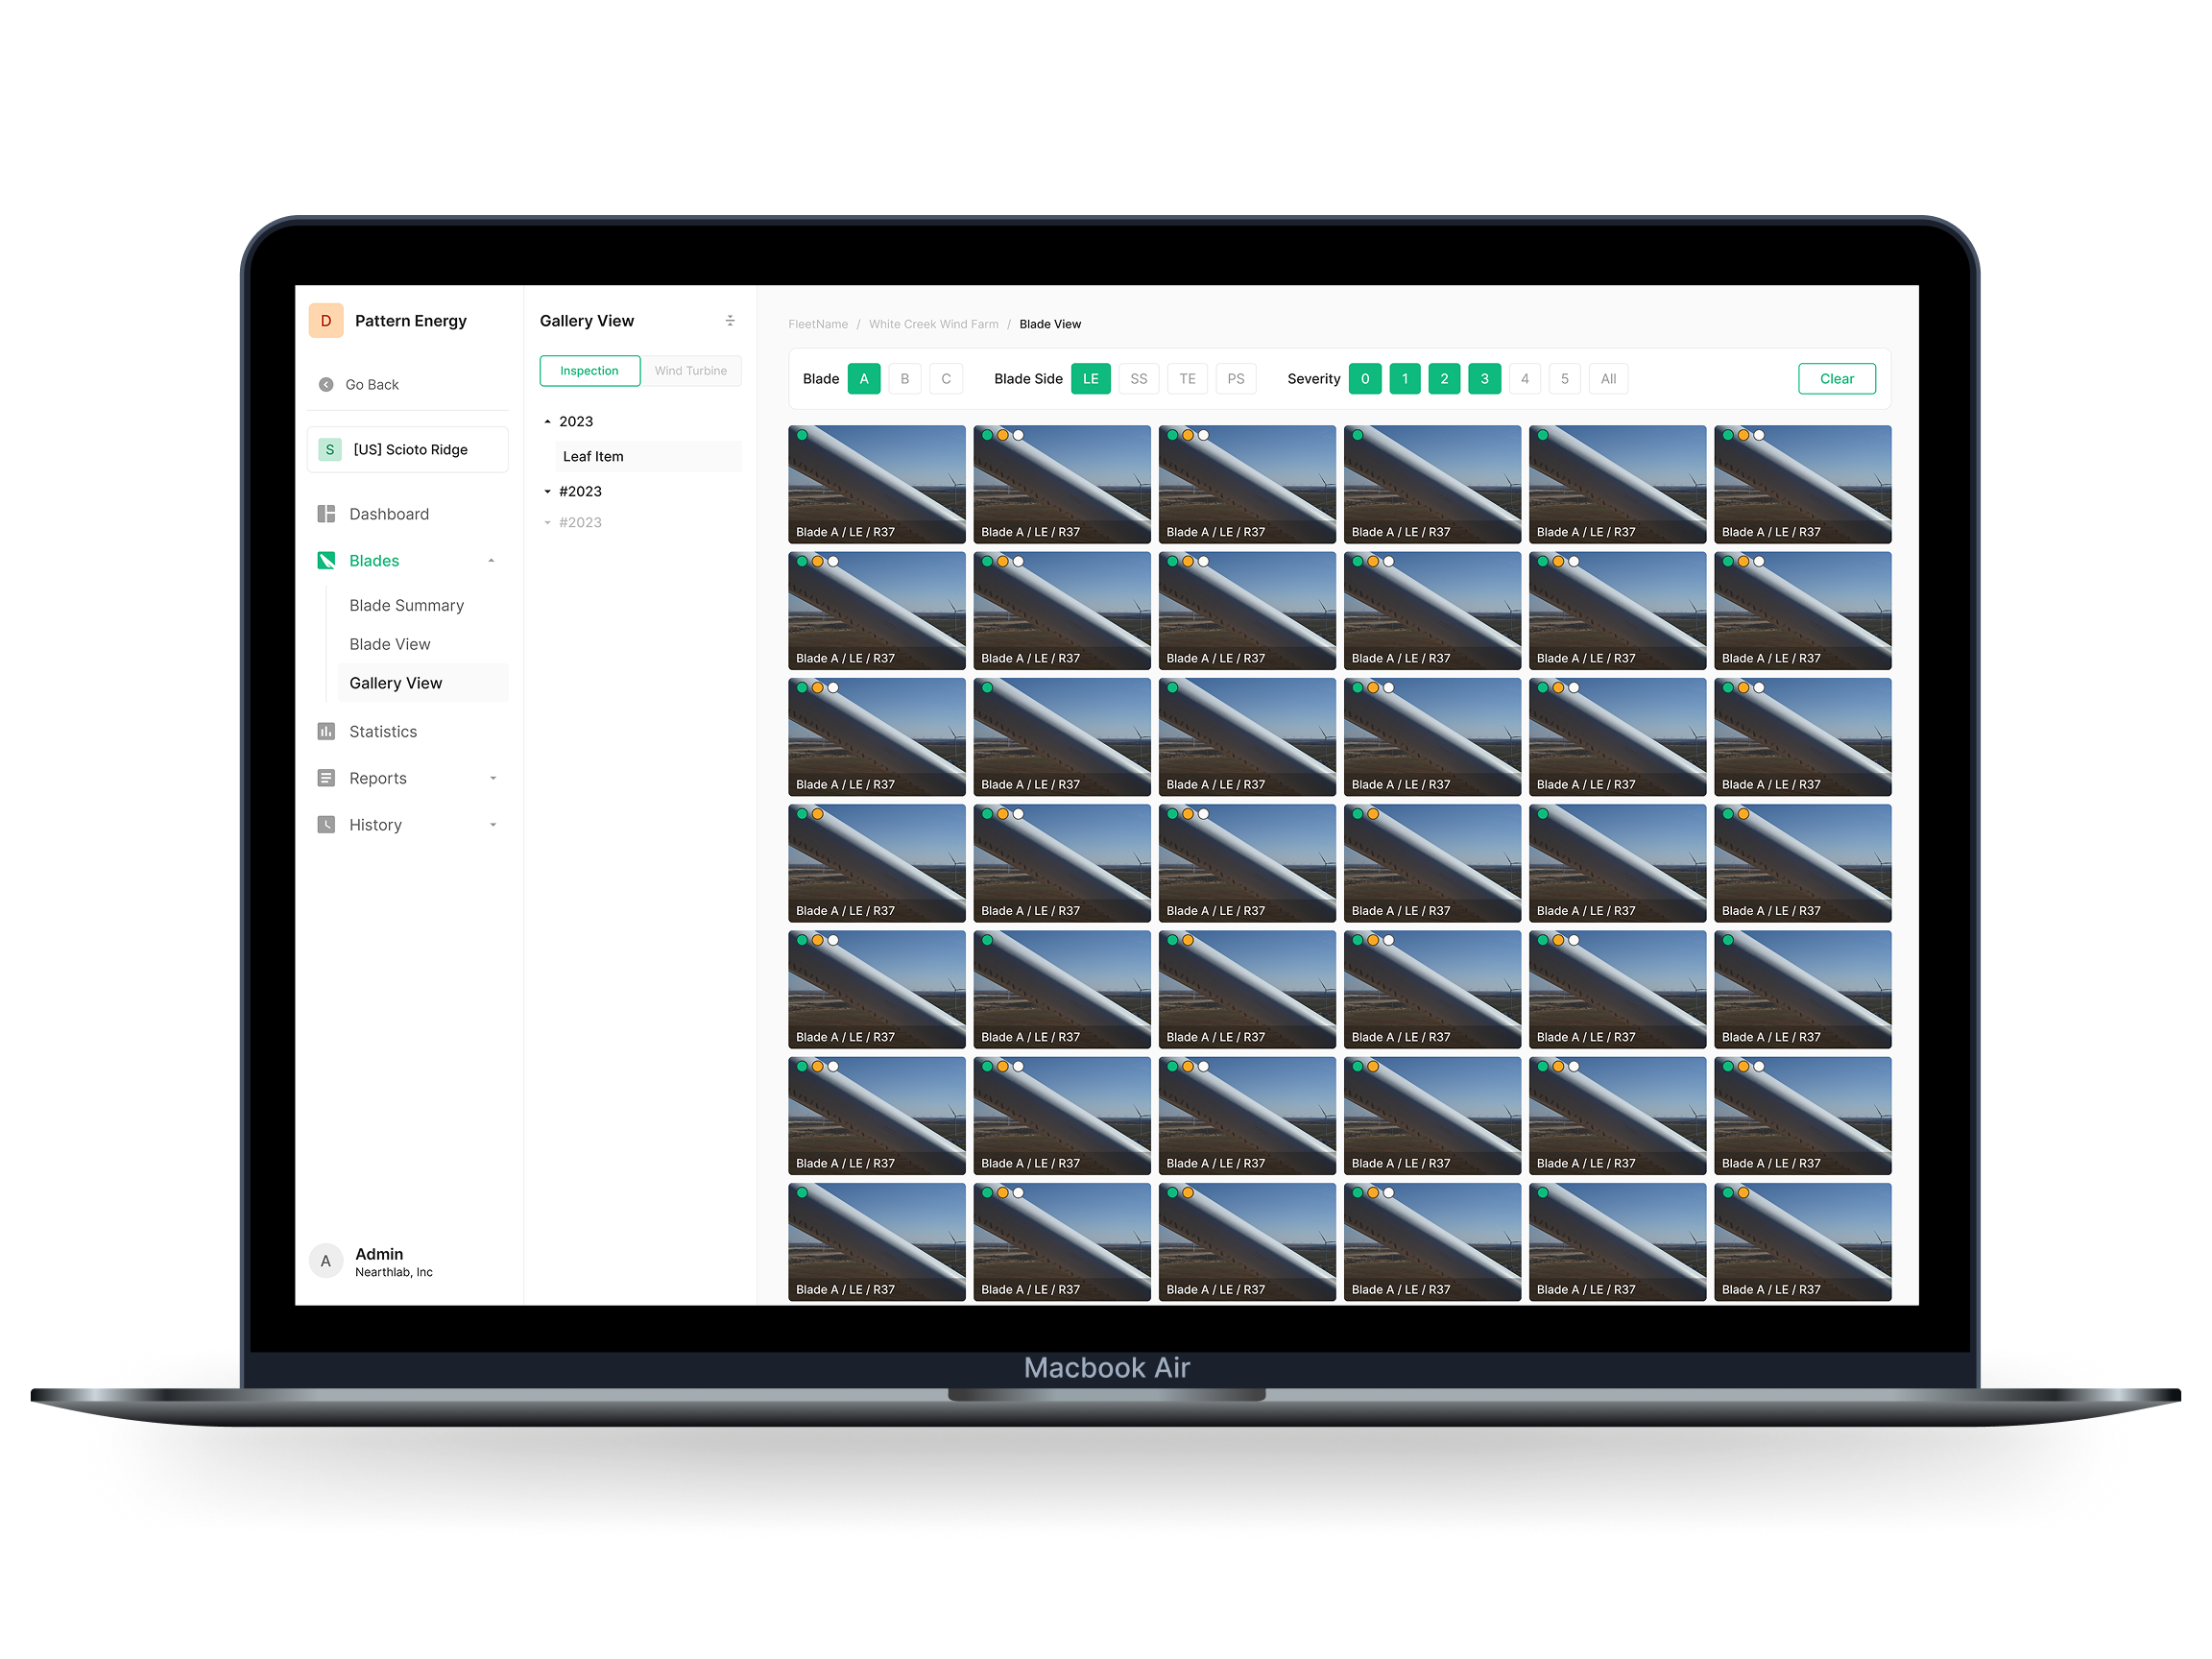
Gallery View
Lists every photo of a specific blade in chronological order. Filter by blade face (front, side) and severity to find only the photos you need — then zoom in for detail.
Core Feature 02
Defects
Photo-first browsing → defect-first issue management
The Defects tab came directly out of customer feedback. The original product only offered photo-first browsing, but customers kept asking to see just the defects. We responded with a dedicated tab focused on defect review and management — and made defect-first information the differentiator against competing products.
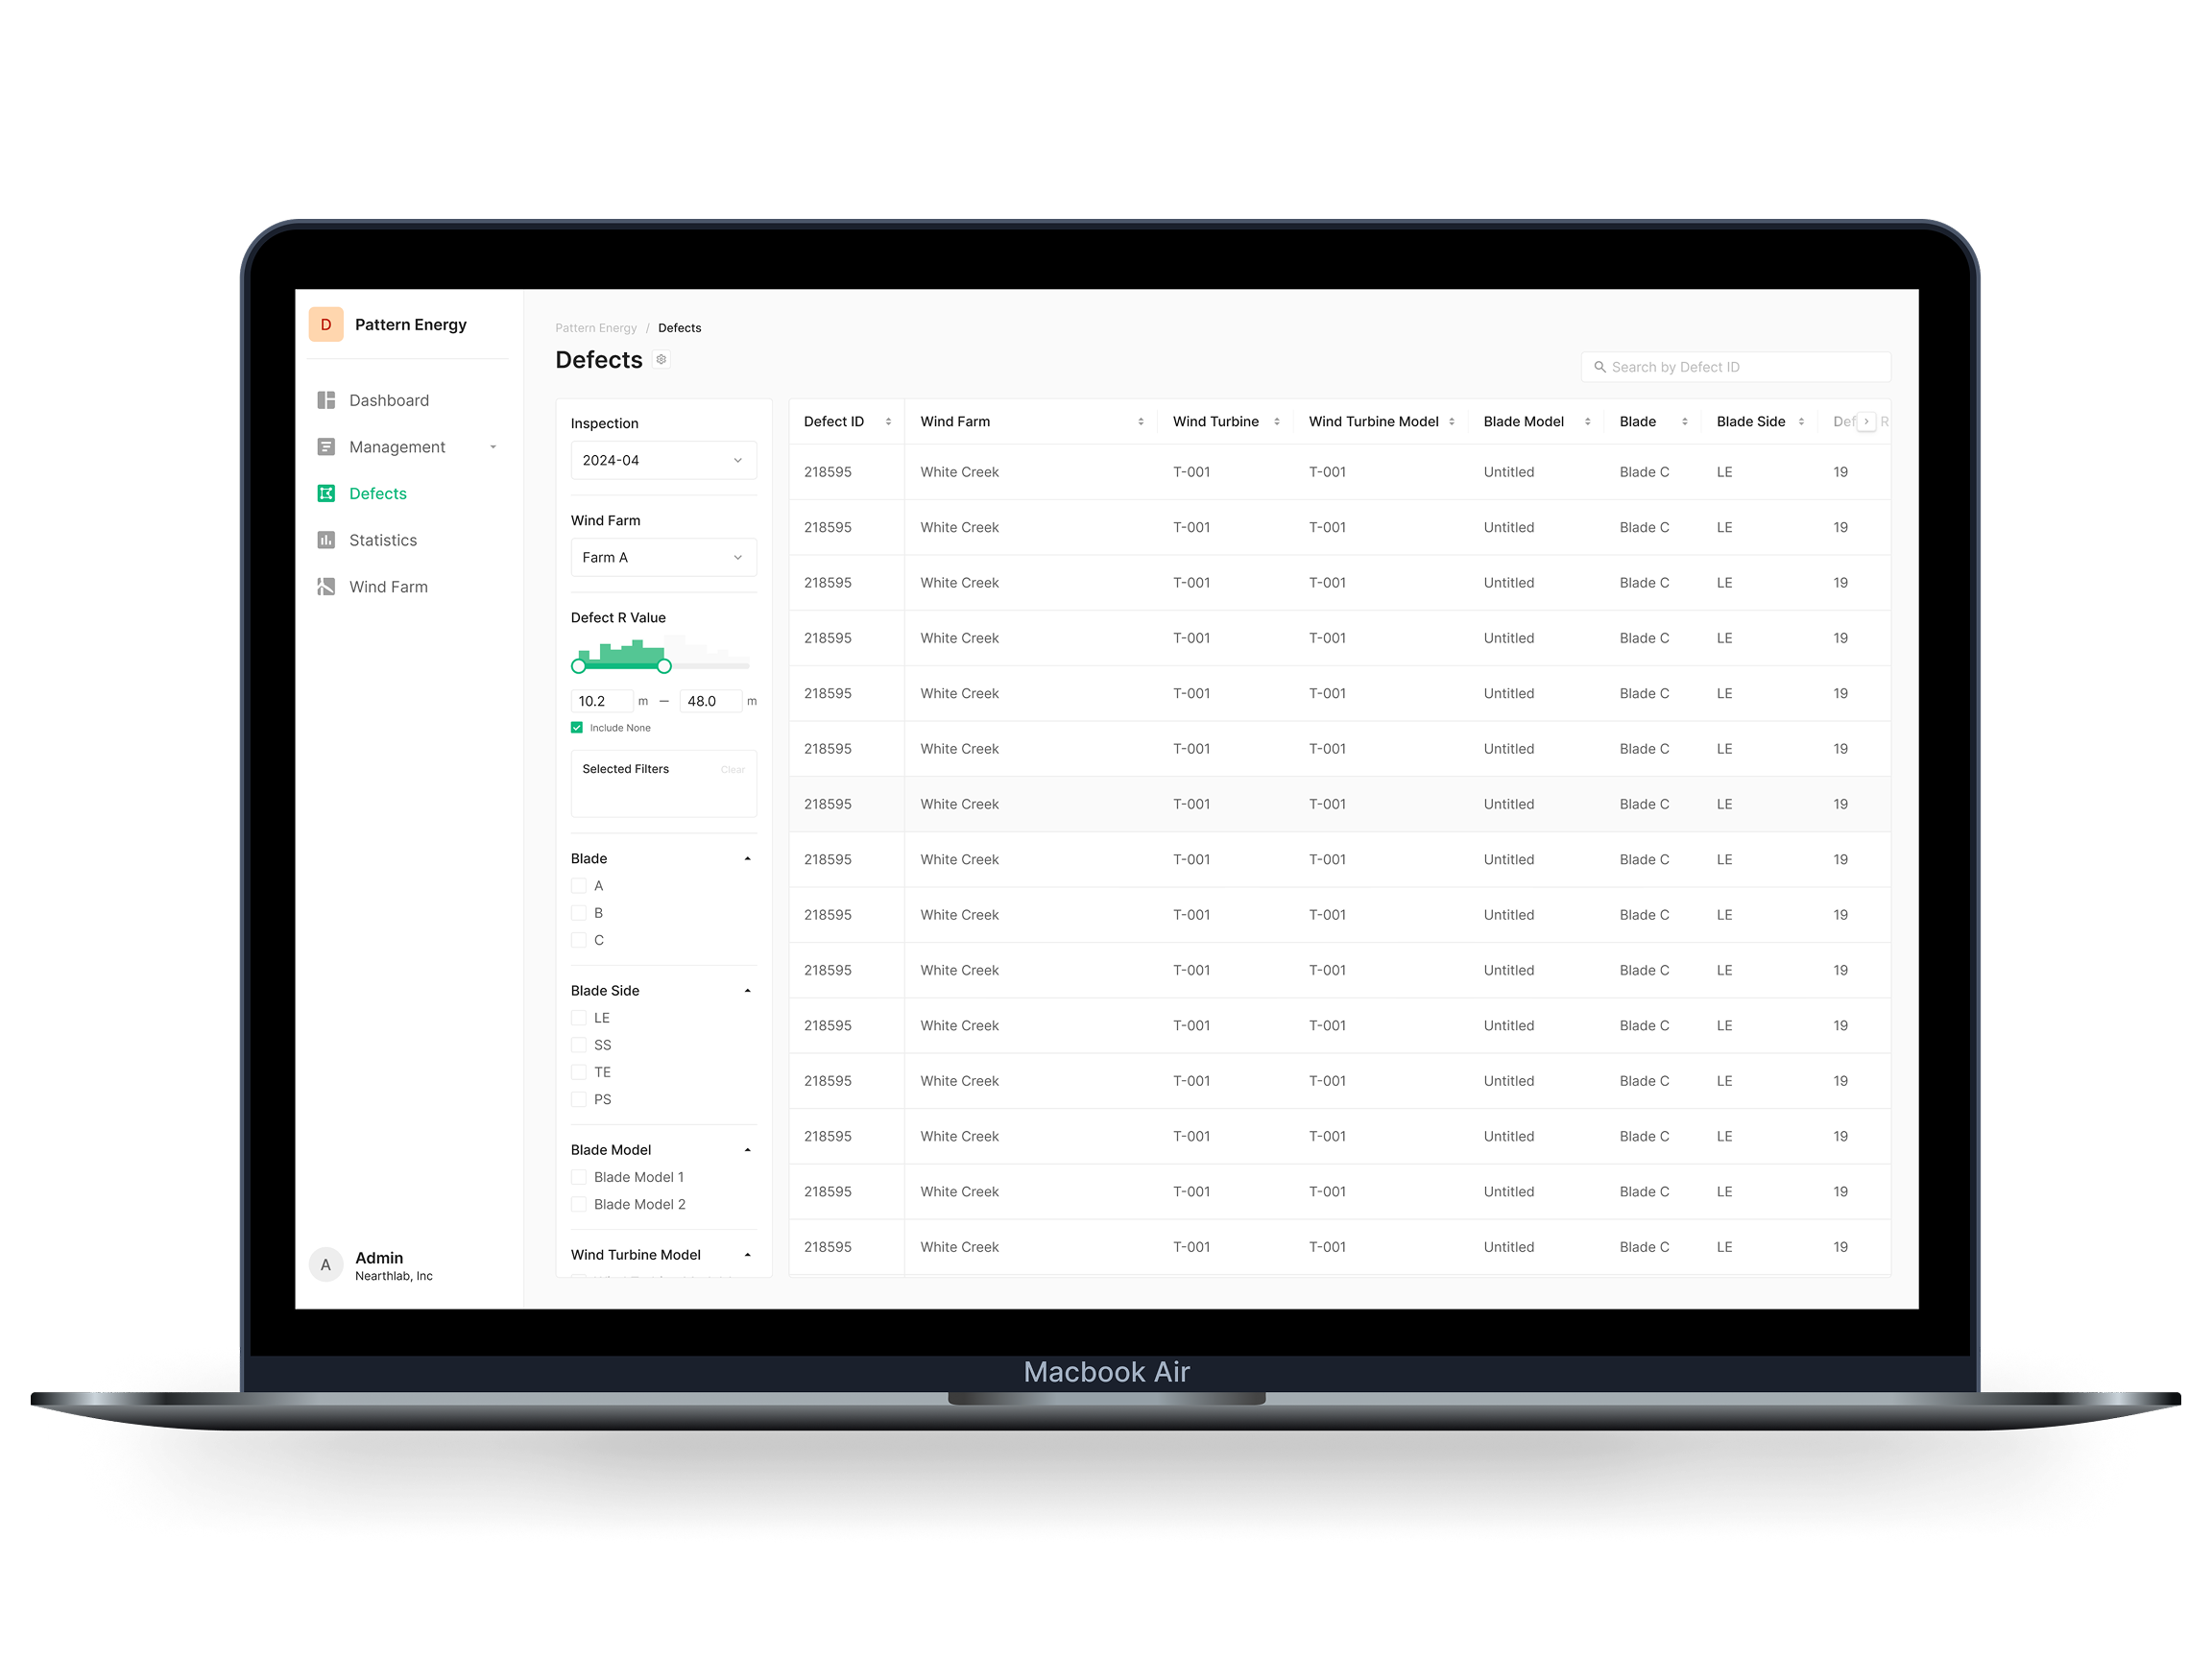
Defect List Table
Every defect, in table form. Sort and filter to read by the criteria you care about, and explore the defect list fast against custom conditions.
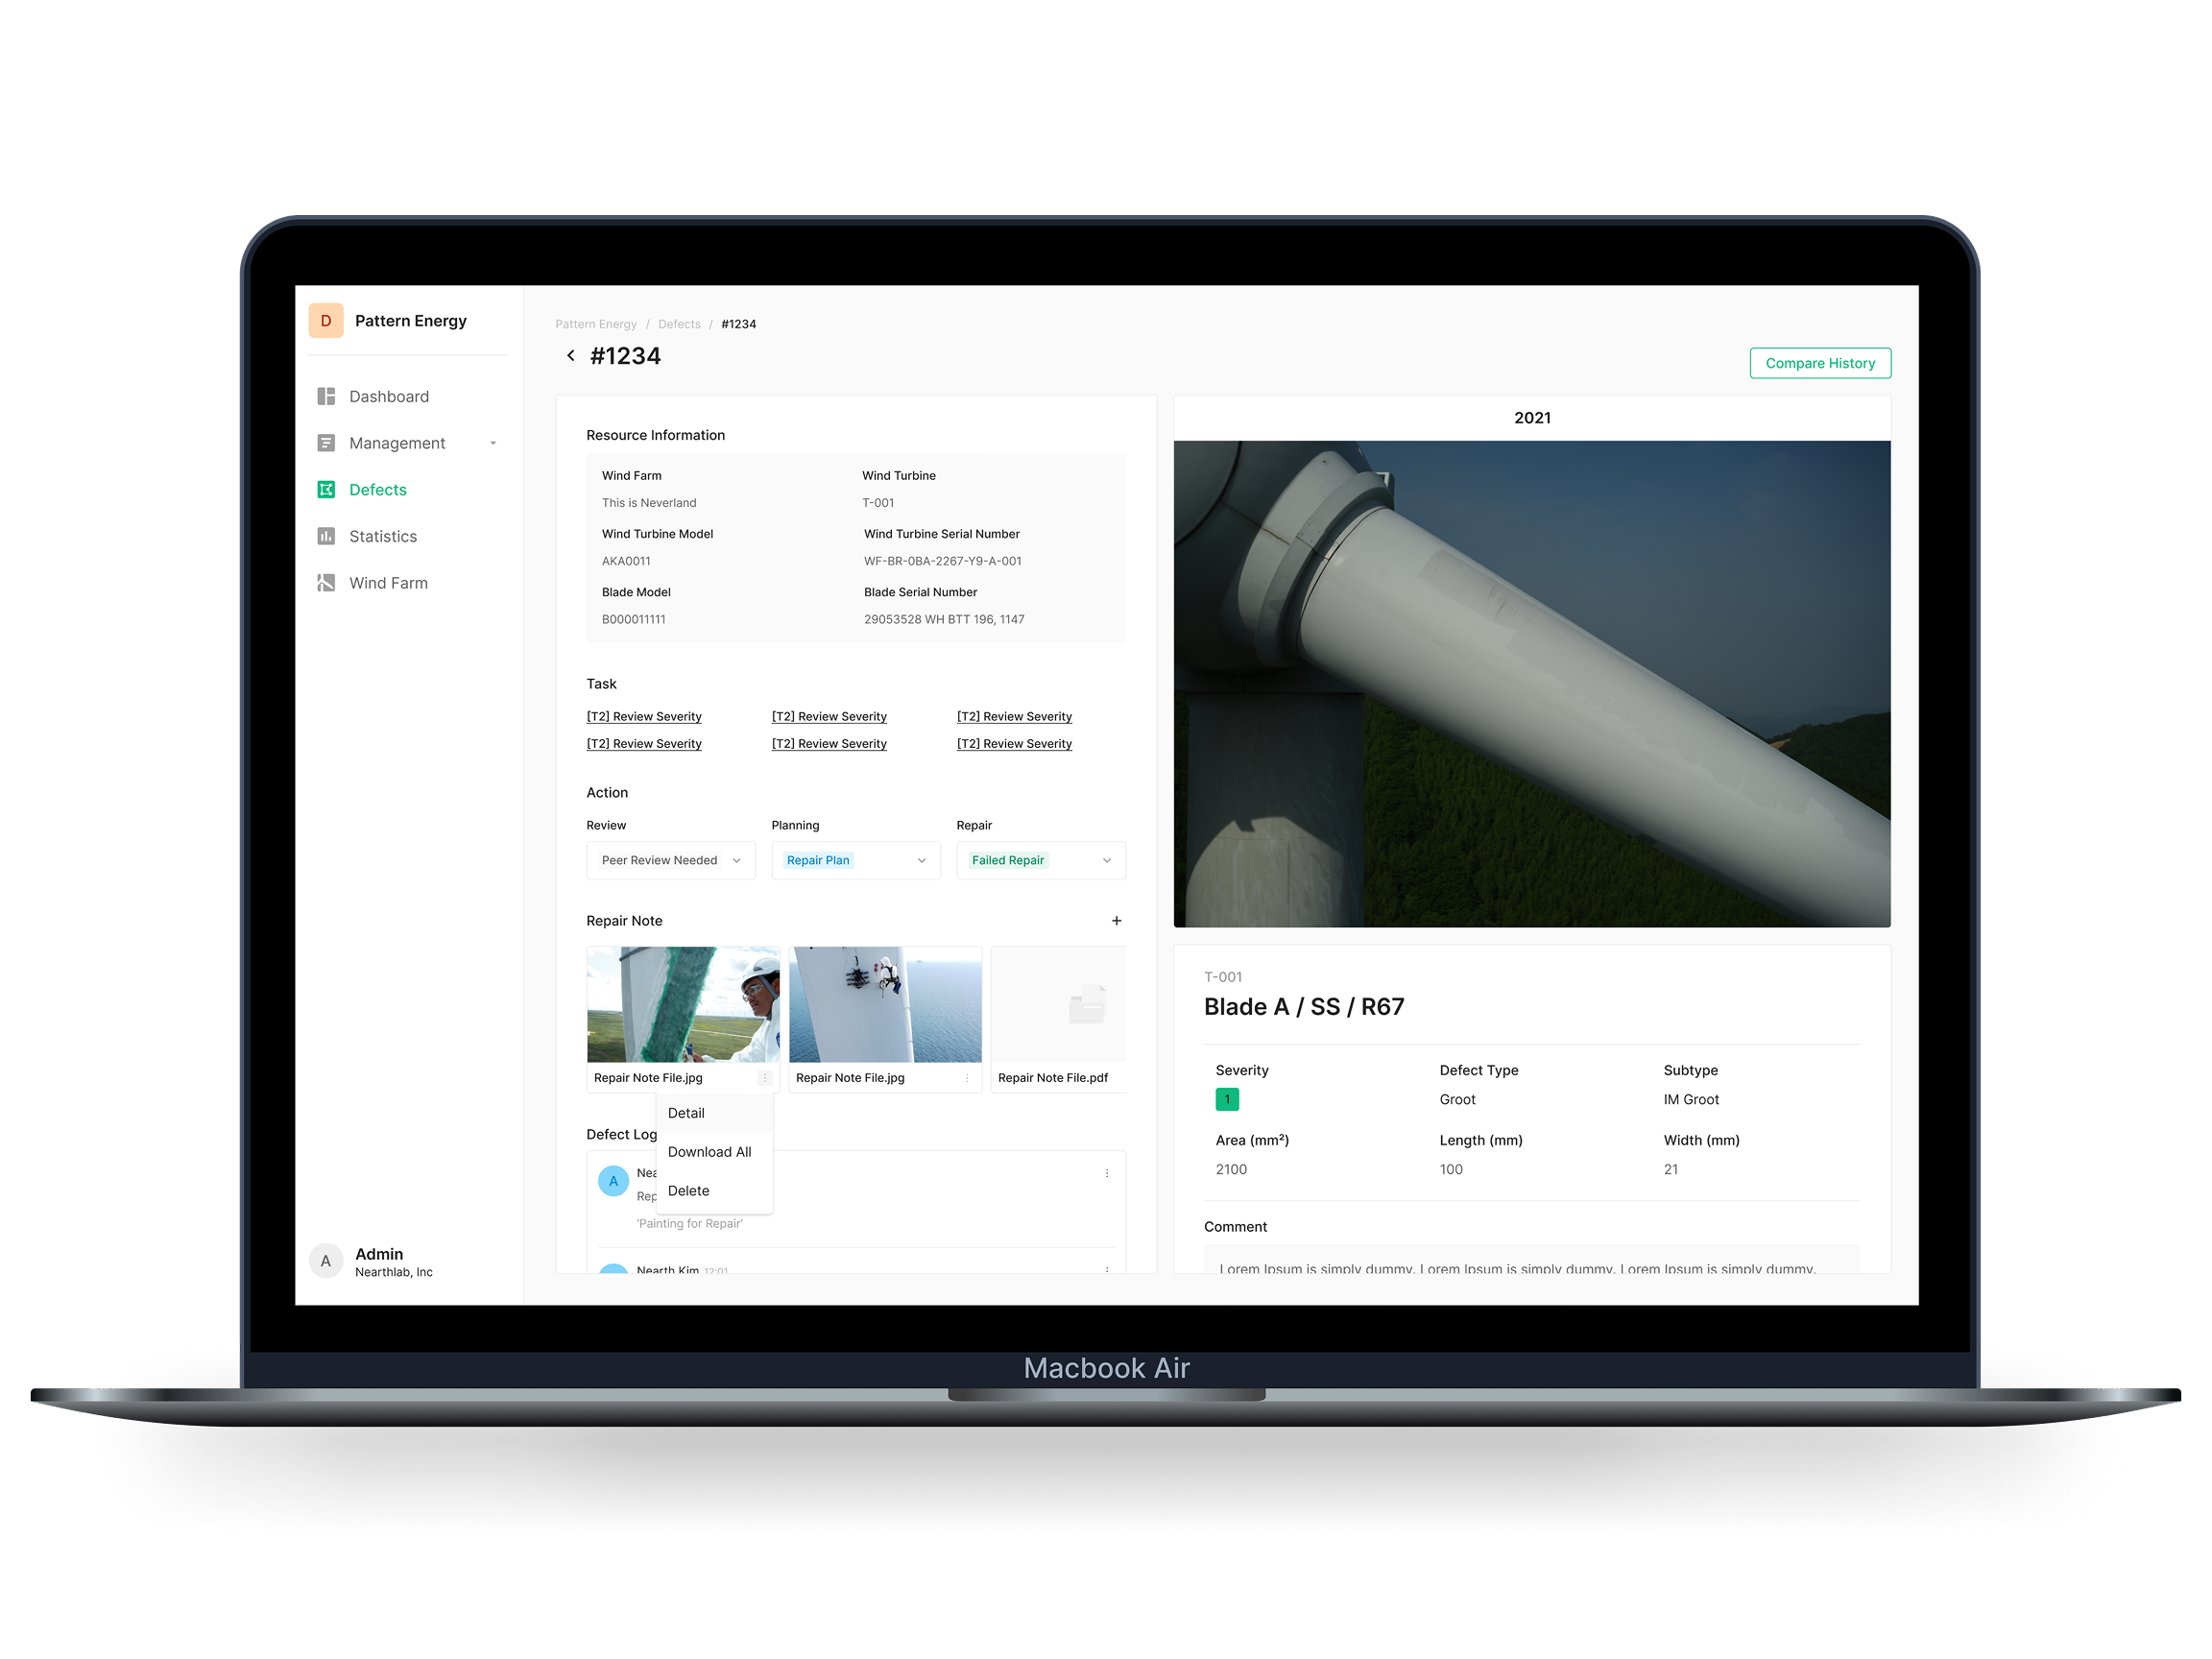
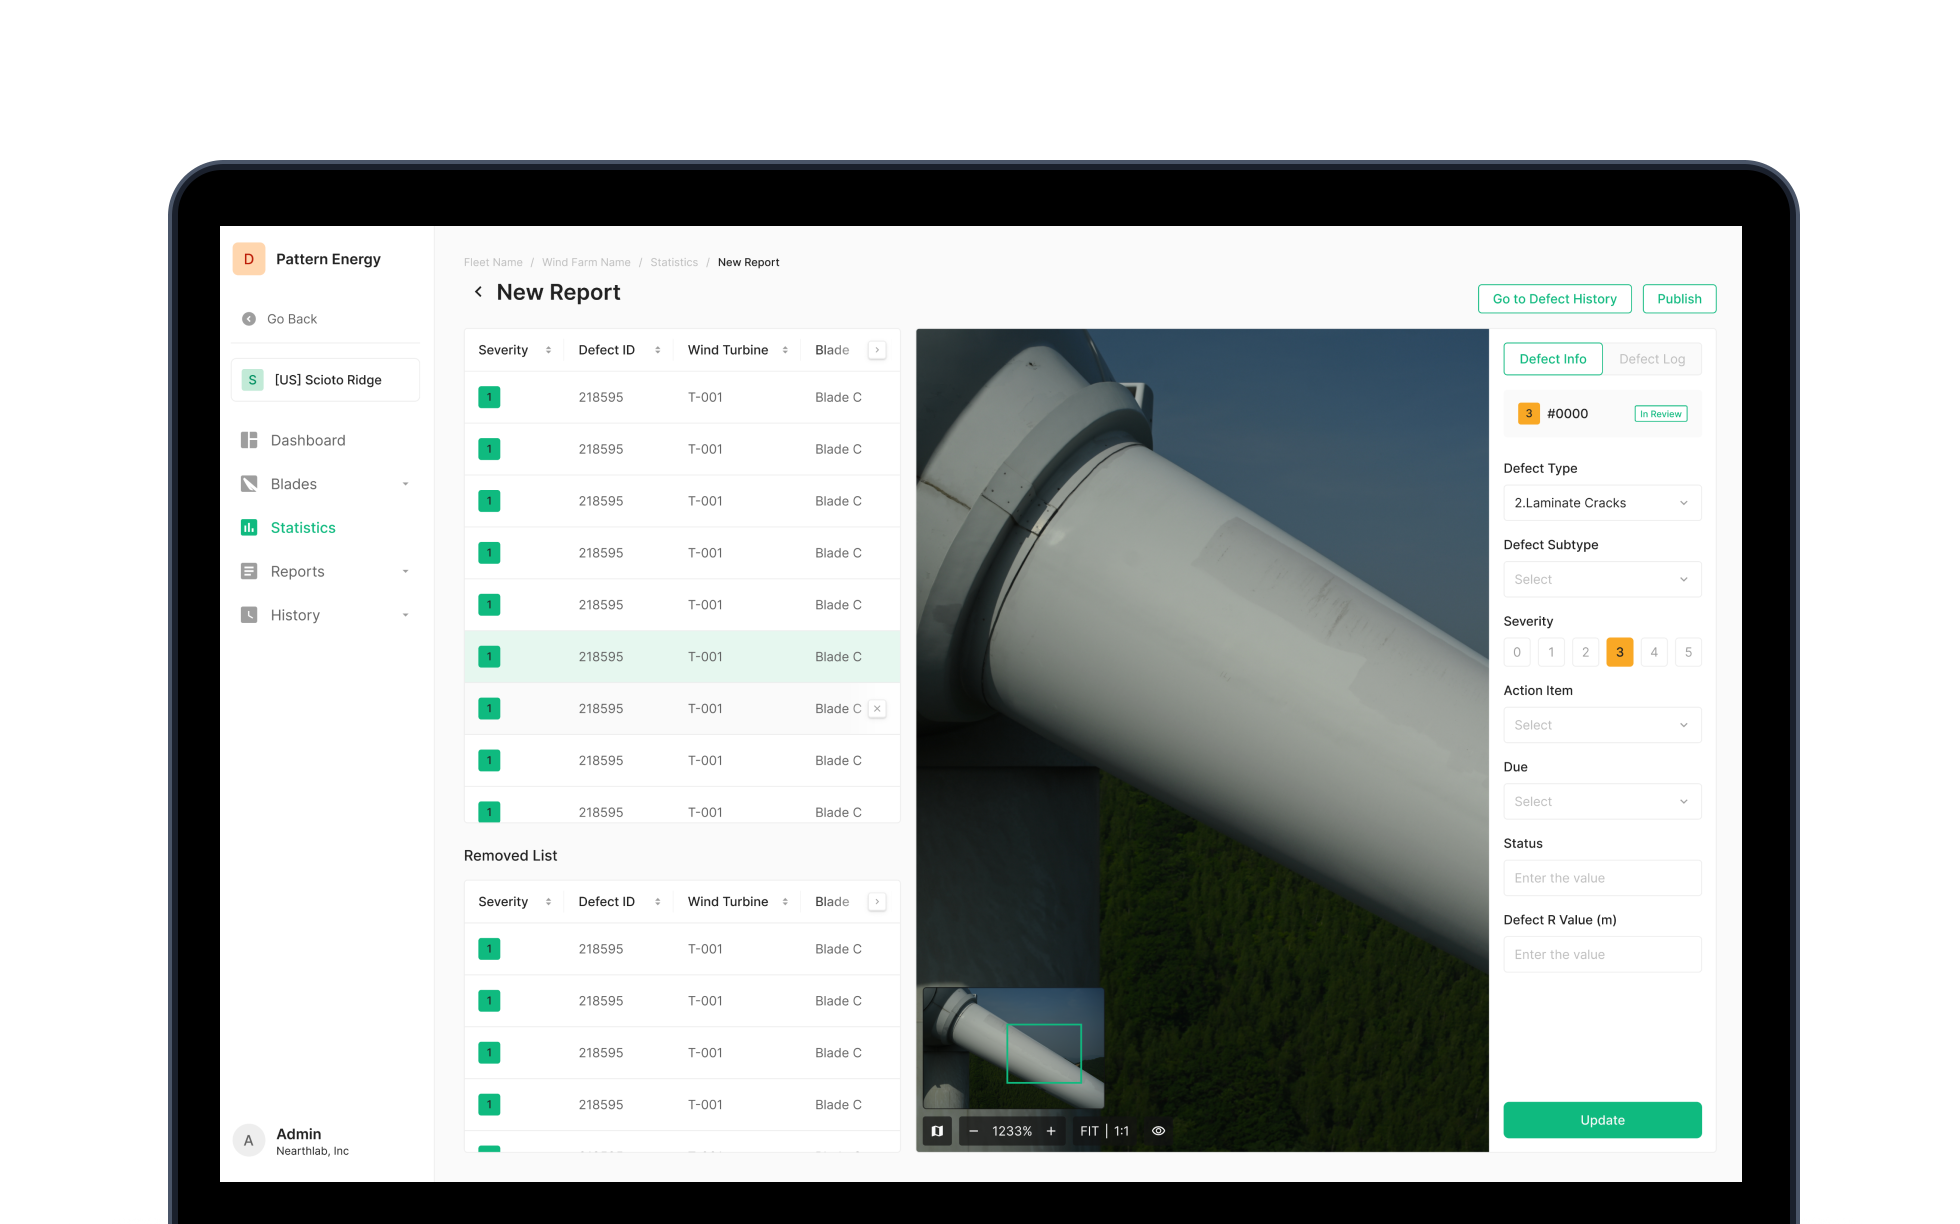
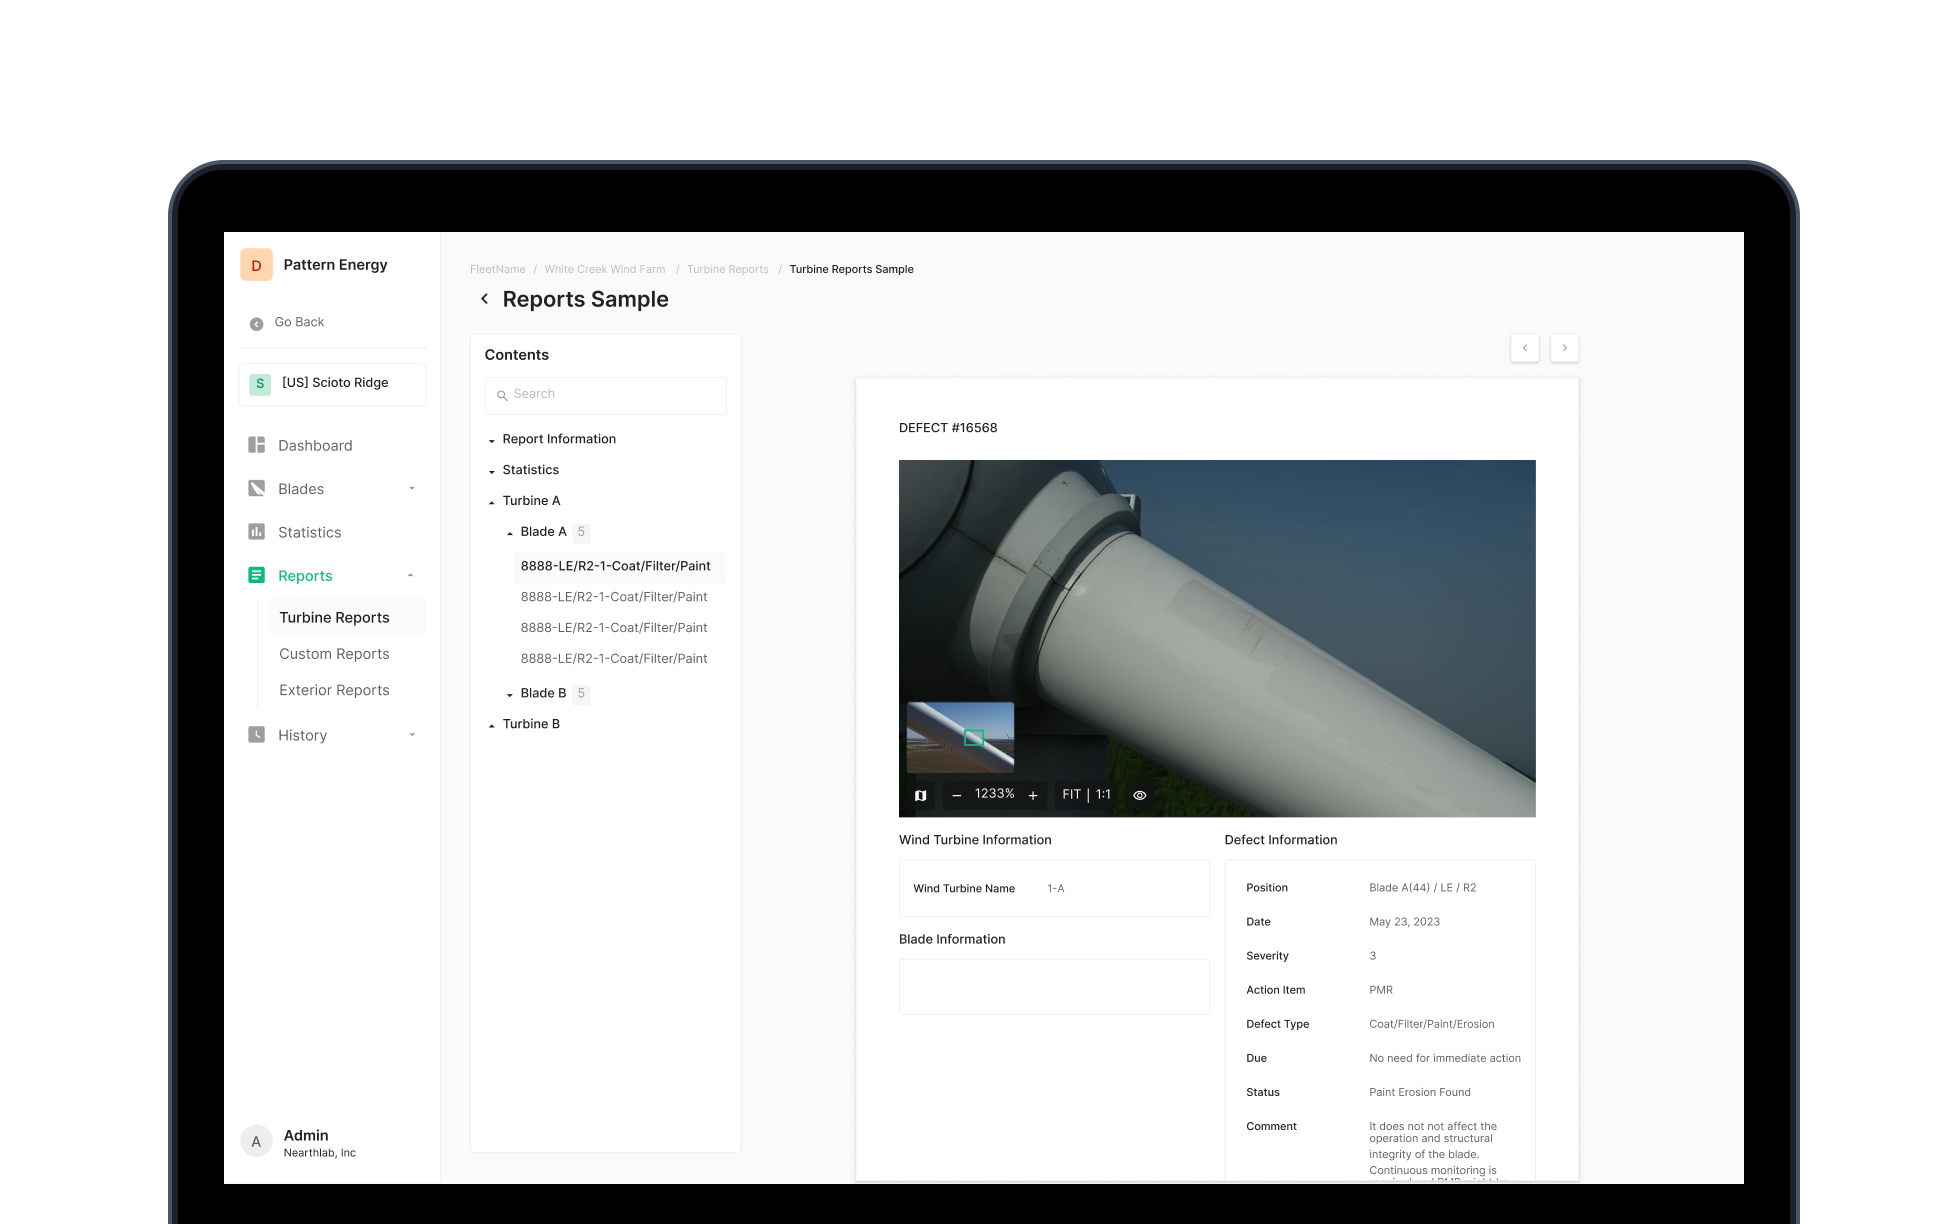
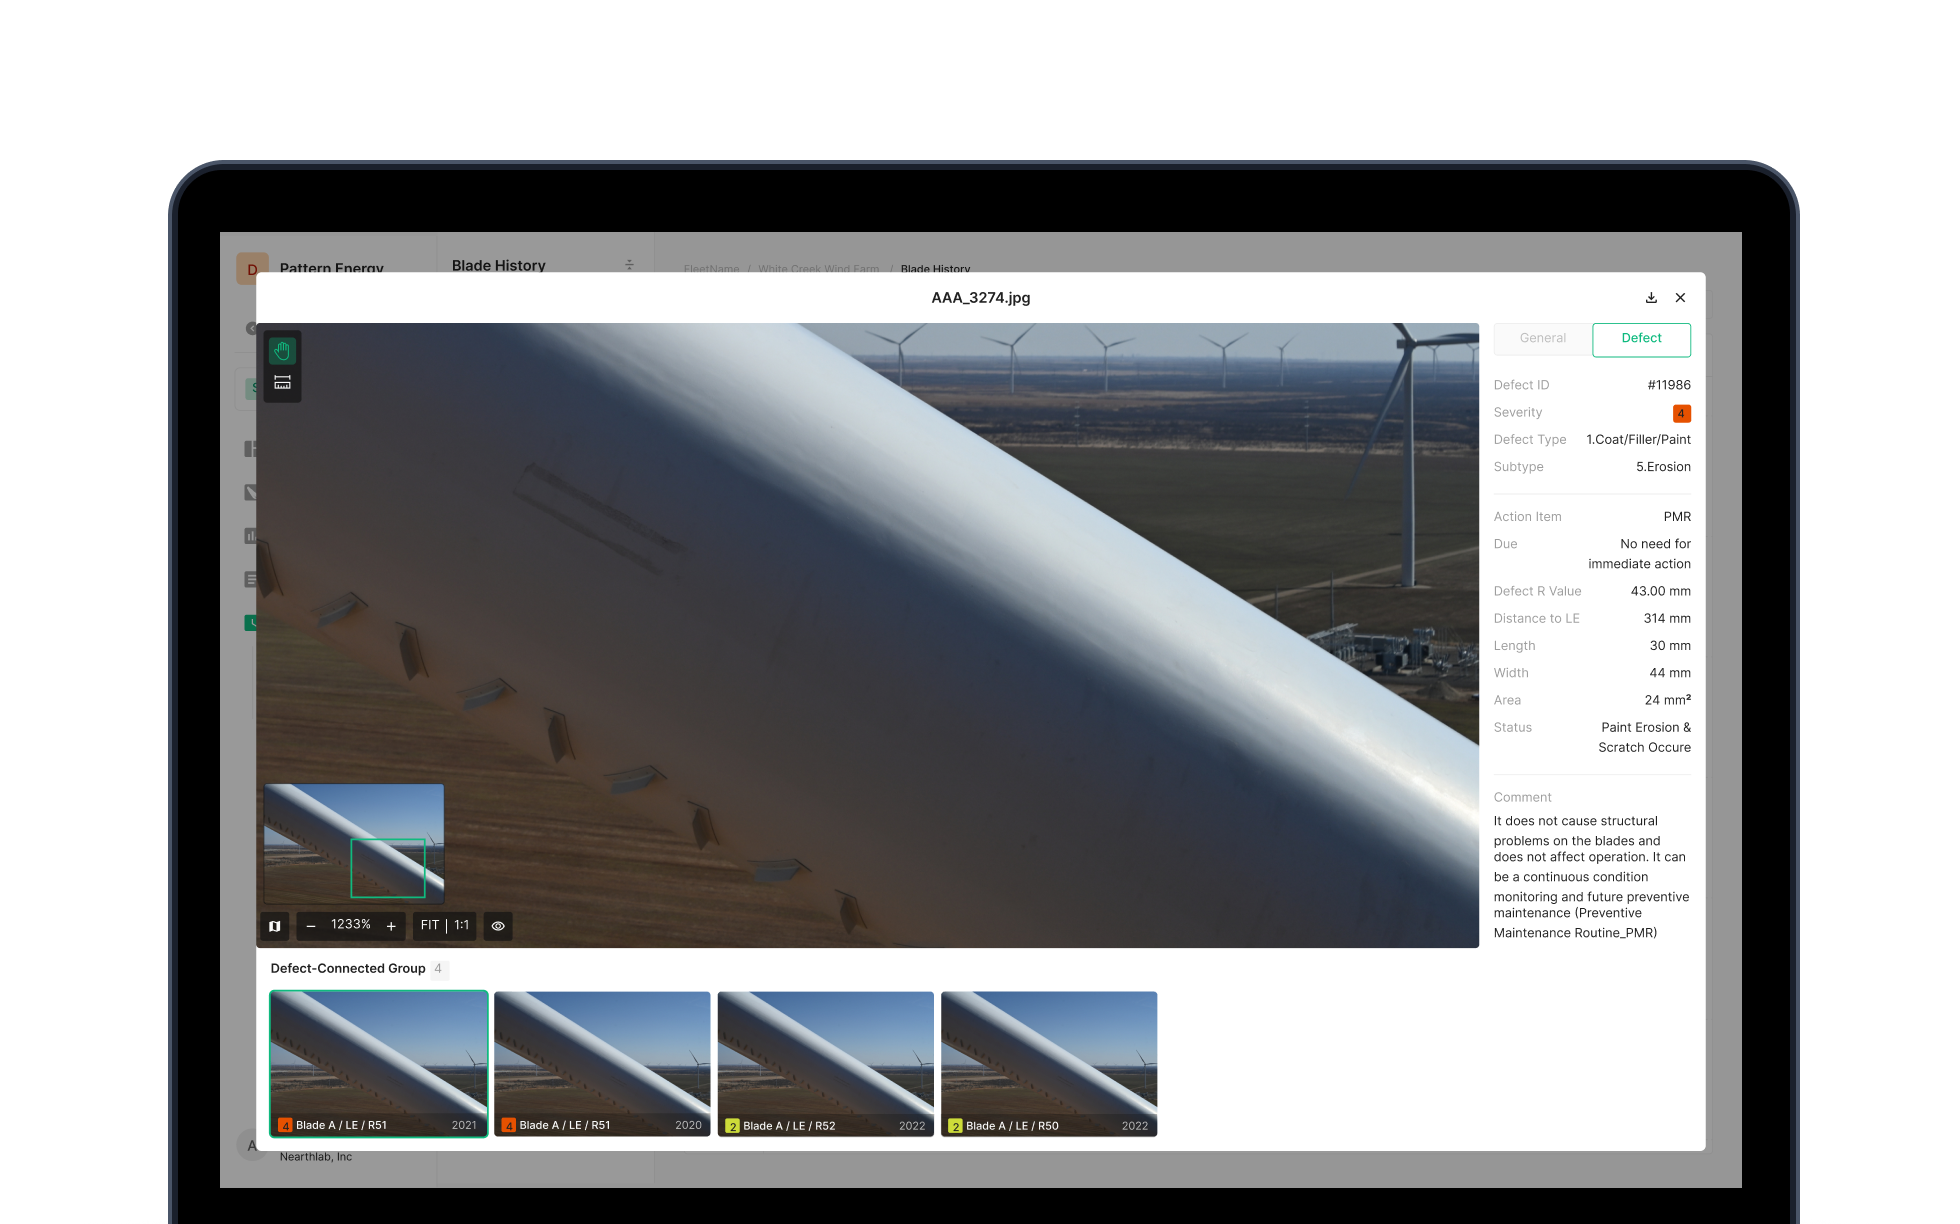
Defect Detail
Full detail for the selected defect. Defect review was split out from the original work and production-focused features — now defect position, severity, and type live on one screen with full focus.
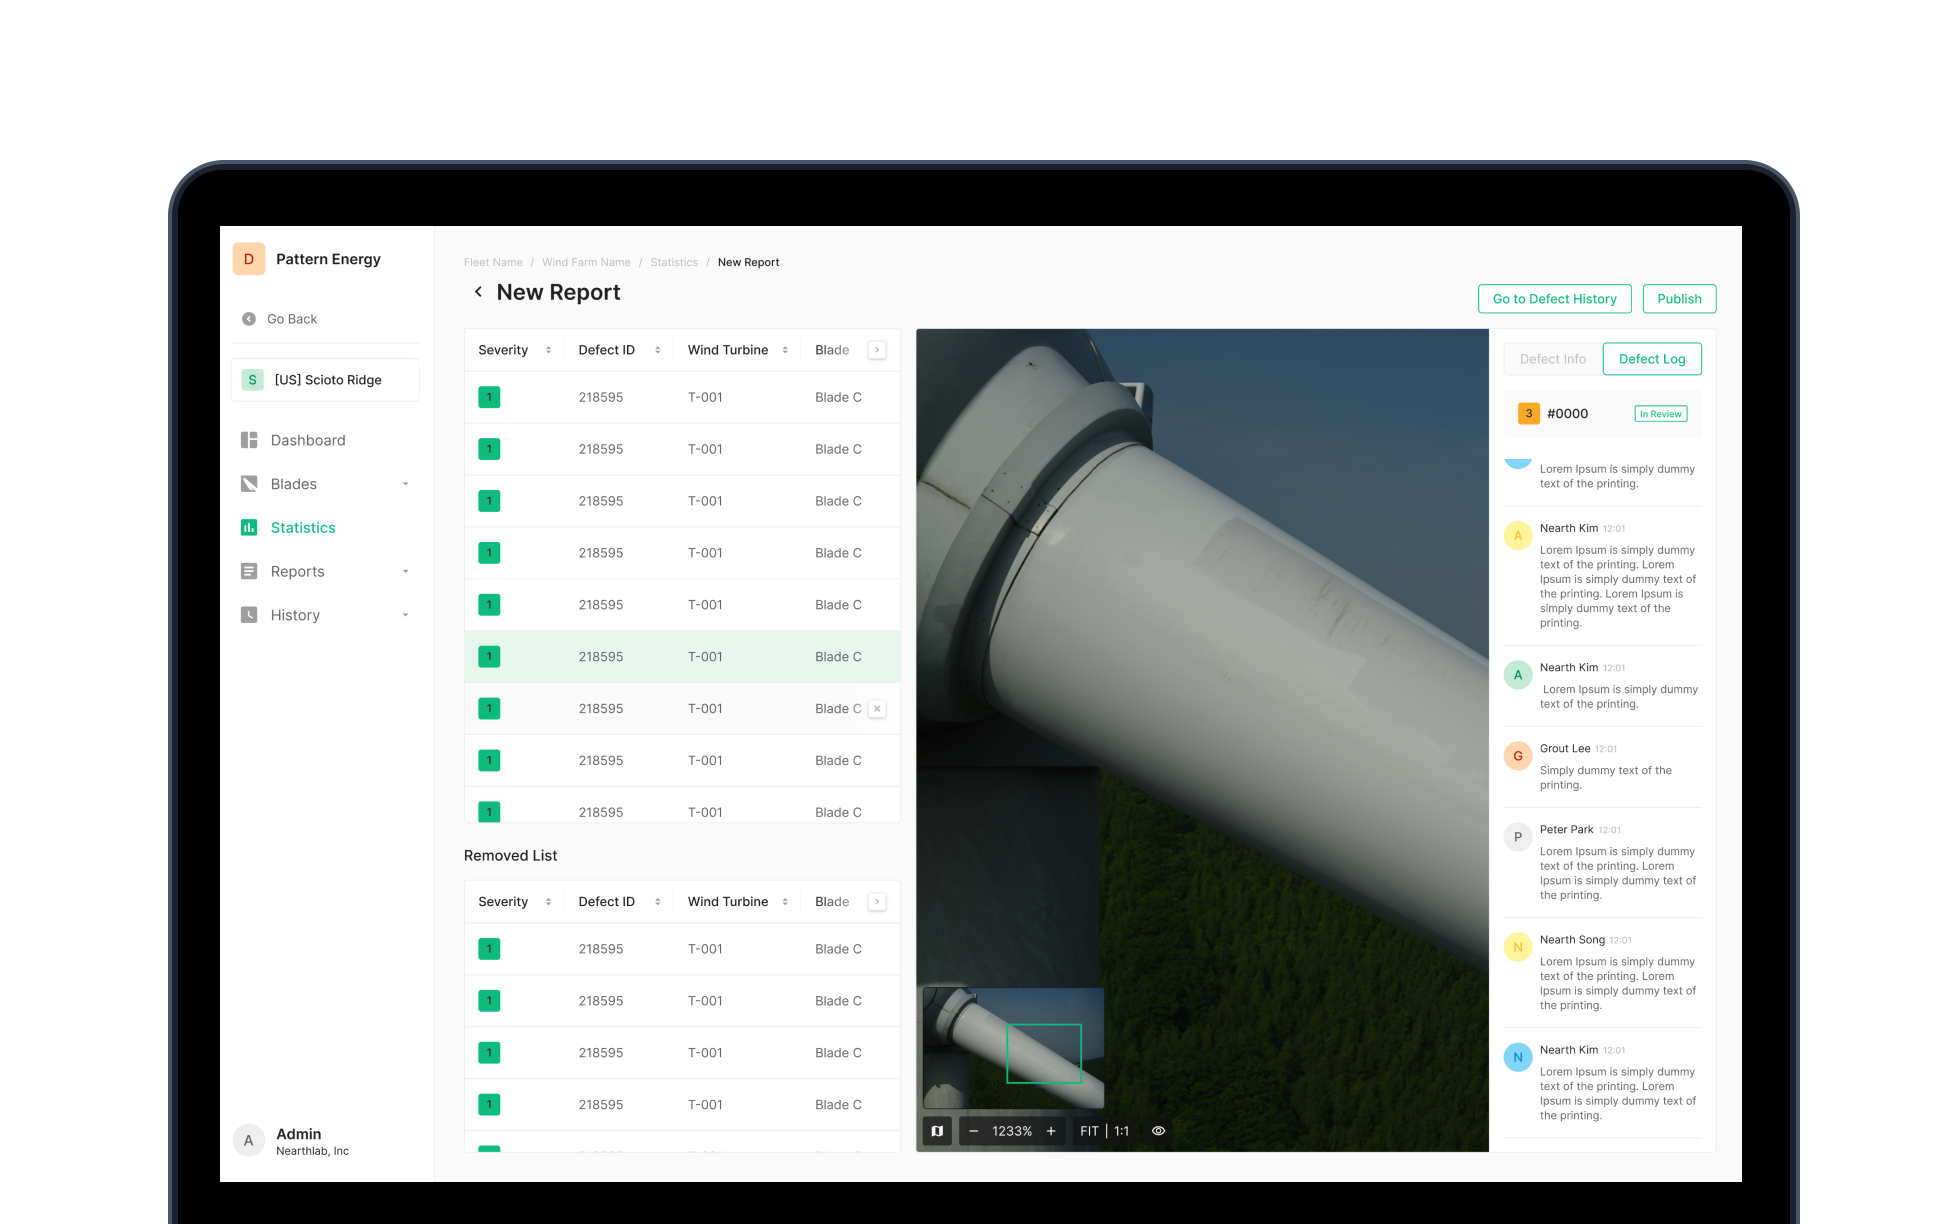
Status Management
Clear tracking of defect status and change history. The audit trail tells you when a defect surfaced and how it was resolved — transparent cross-team collaboration follows.
Core Feature 03
Statistics
Built to analyze wind turbine inspection results holistically. Set conditions via data filtering, compare statistics visually by severity, type, or model, and generate a PDF report from the result — the full workflow finishes in one tab.
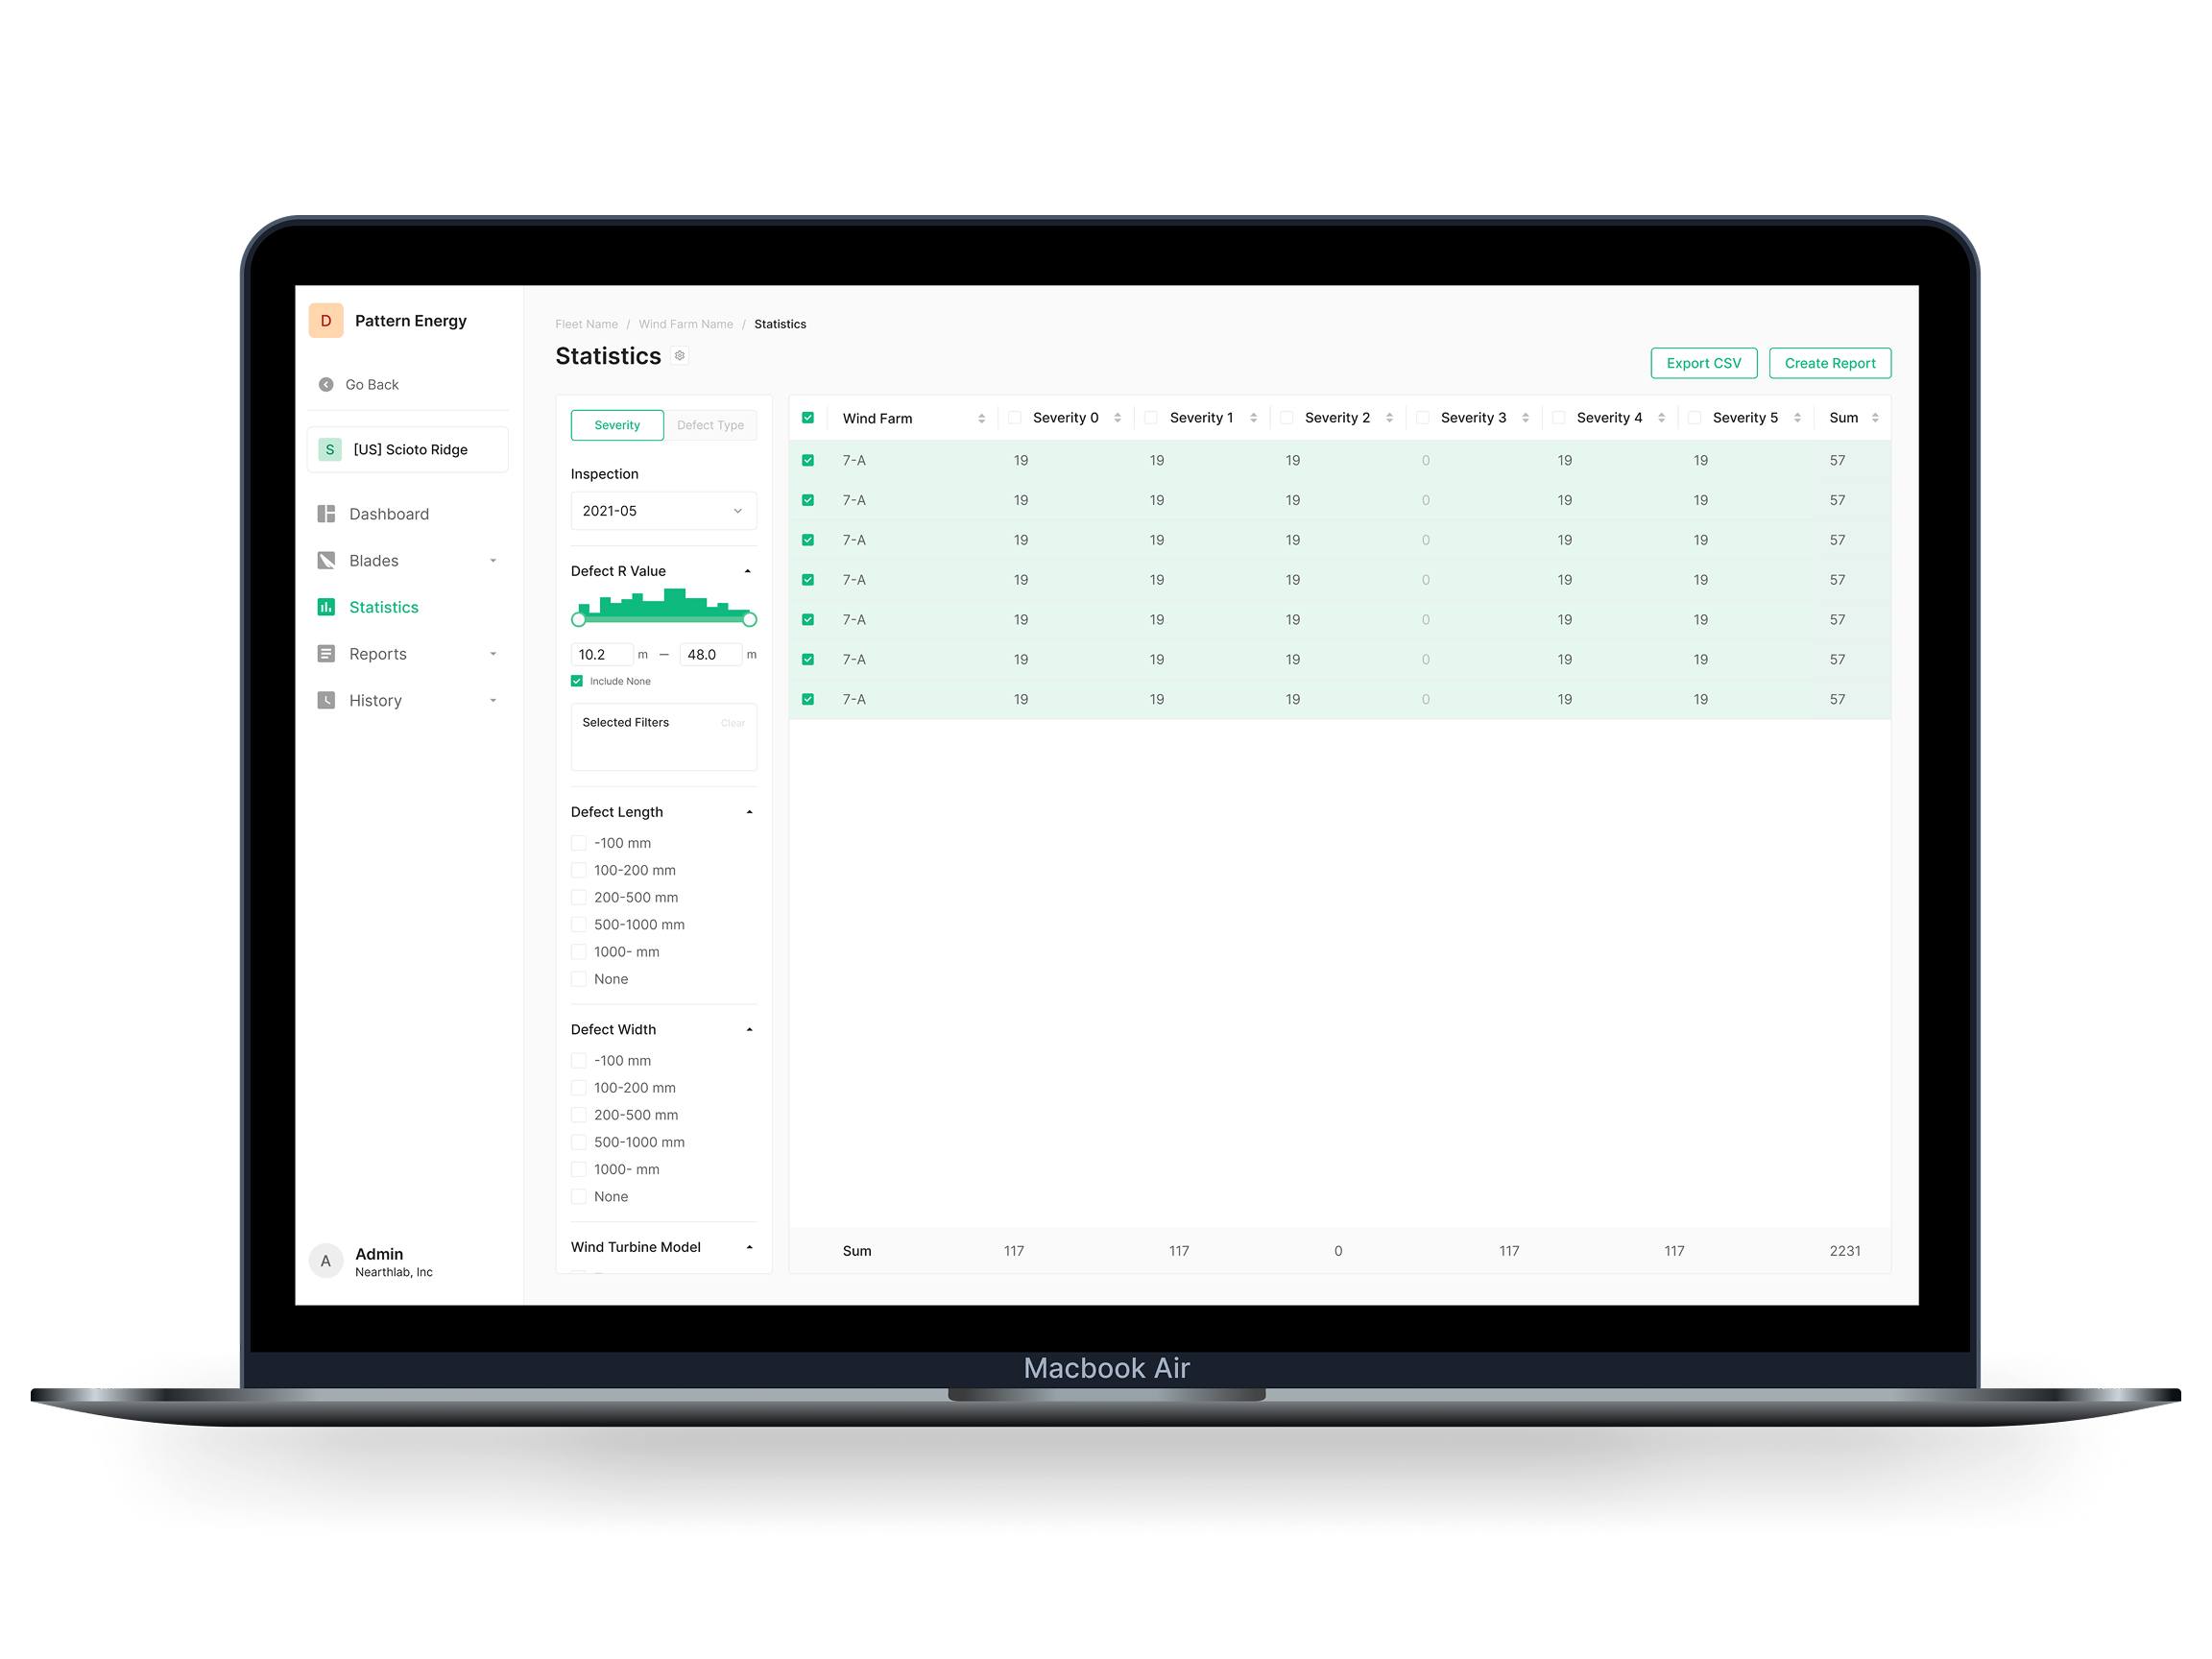
Data filtering + classification
Filter by severity, defect type, blade face, model, and more. Defect ID and completion state let you fine-tune the analysis scope.
Visual data analysis
Filtered statistics render as graphs and charts — defect distribution and severity trends read at a glance. Data-driven maintenance decisions follow.
Report generation
Generate PDF reports directly from analyzed statistics. Set detail conditions — defect ID, blade face, model, defect type — to produce a tailored report.
Core Feature 04
Reports
Built to consolidate wind turbine inspection data into reports and manage them. Two report types: Turbine Reports the system auto-generates, and Custom Reports the user shapes by setting conditions themselves.
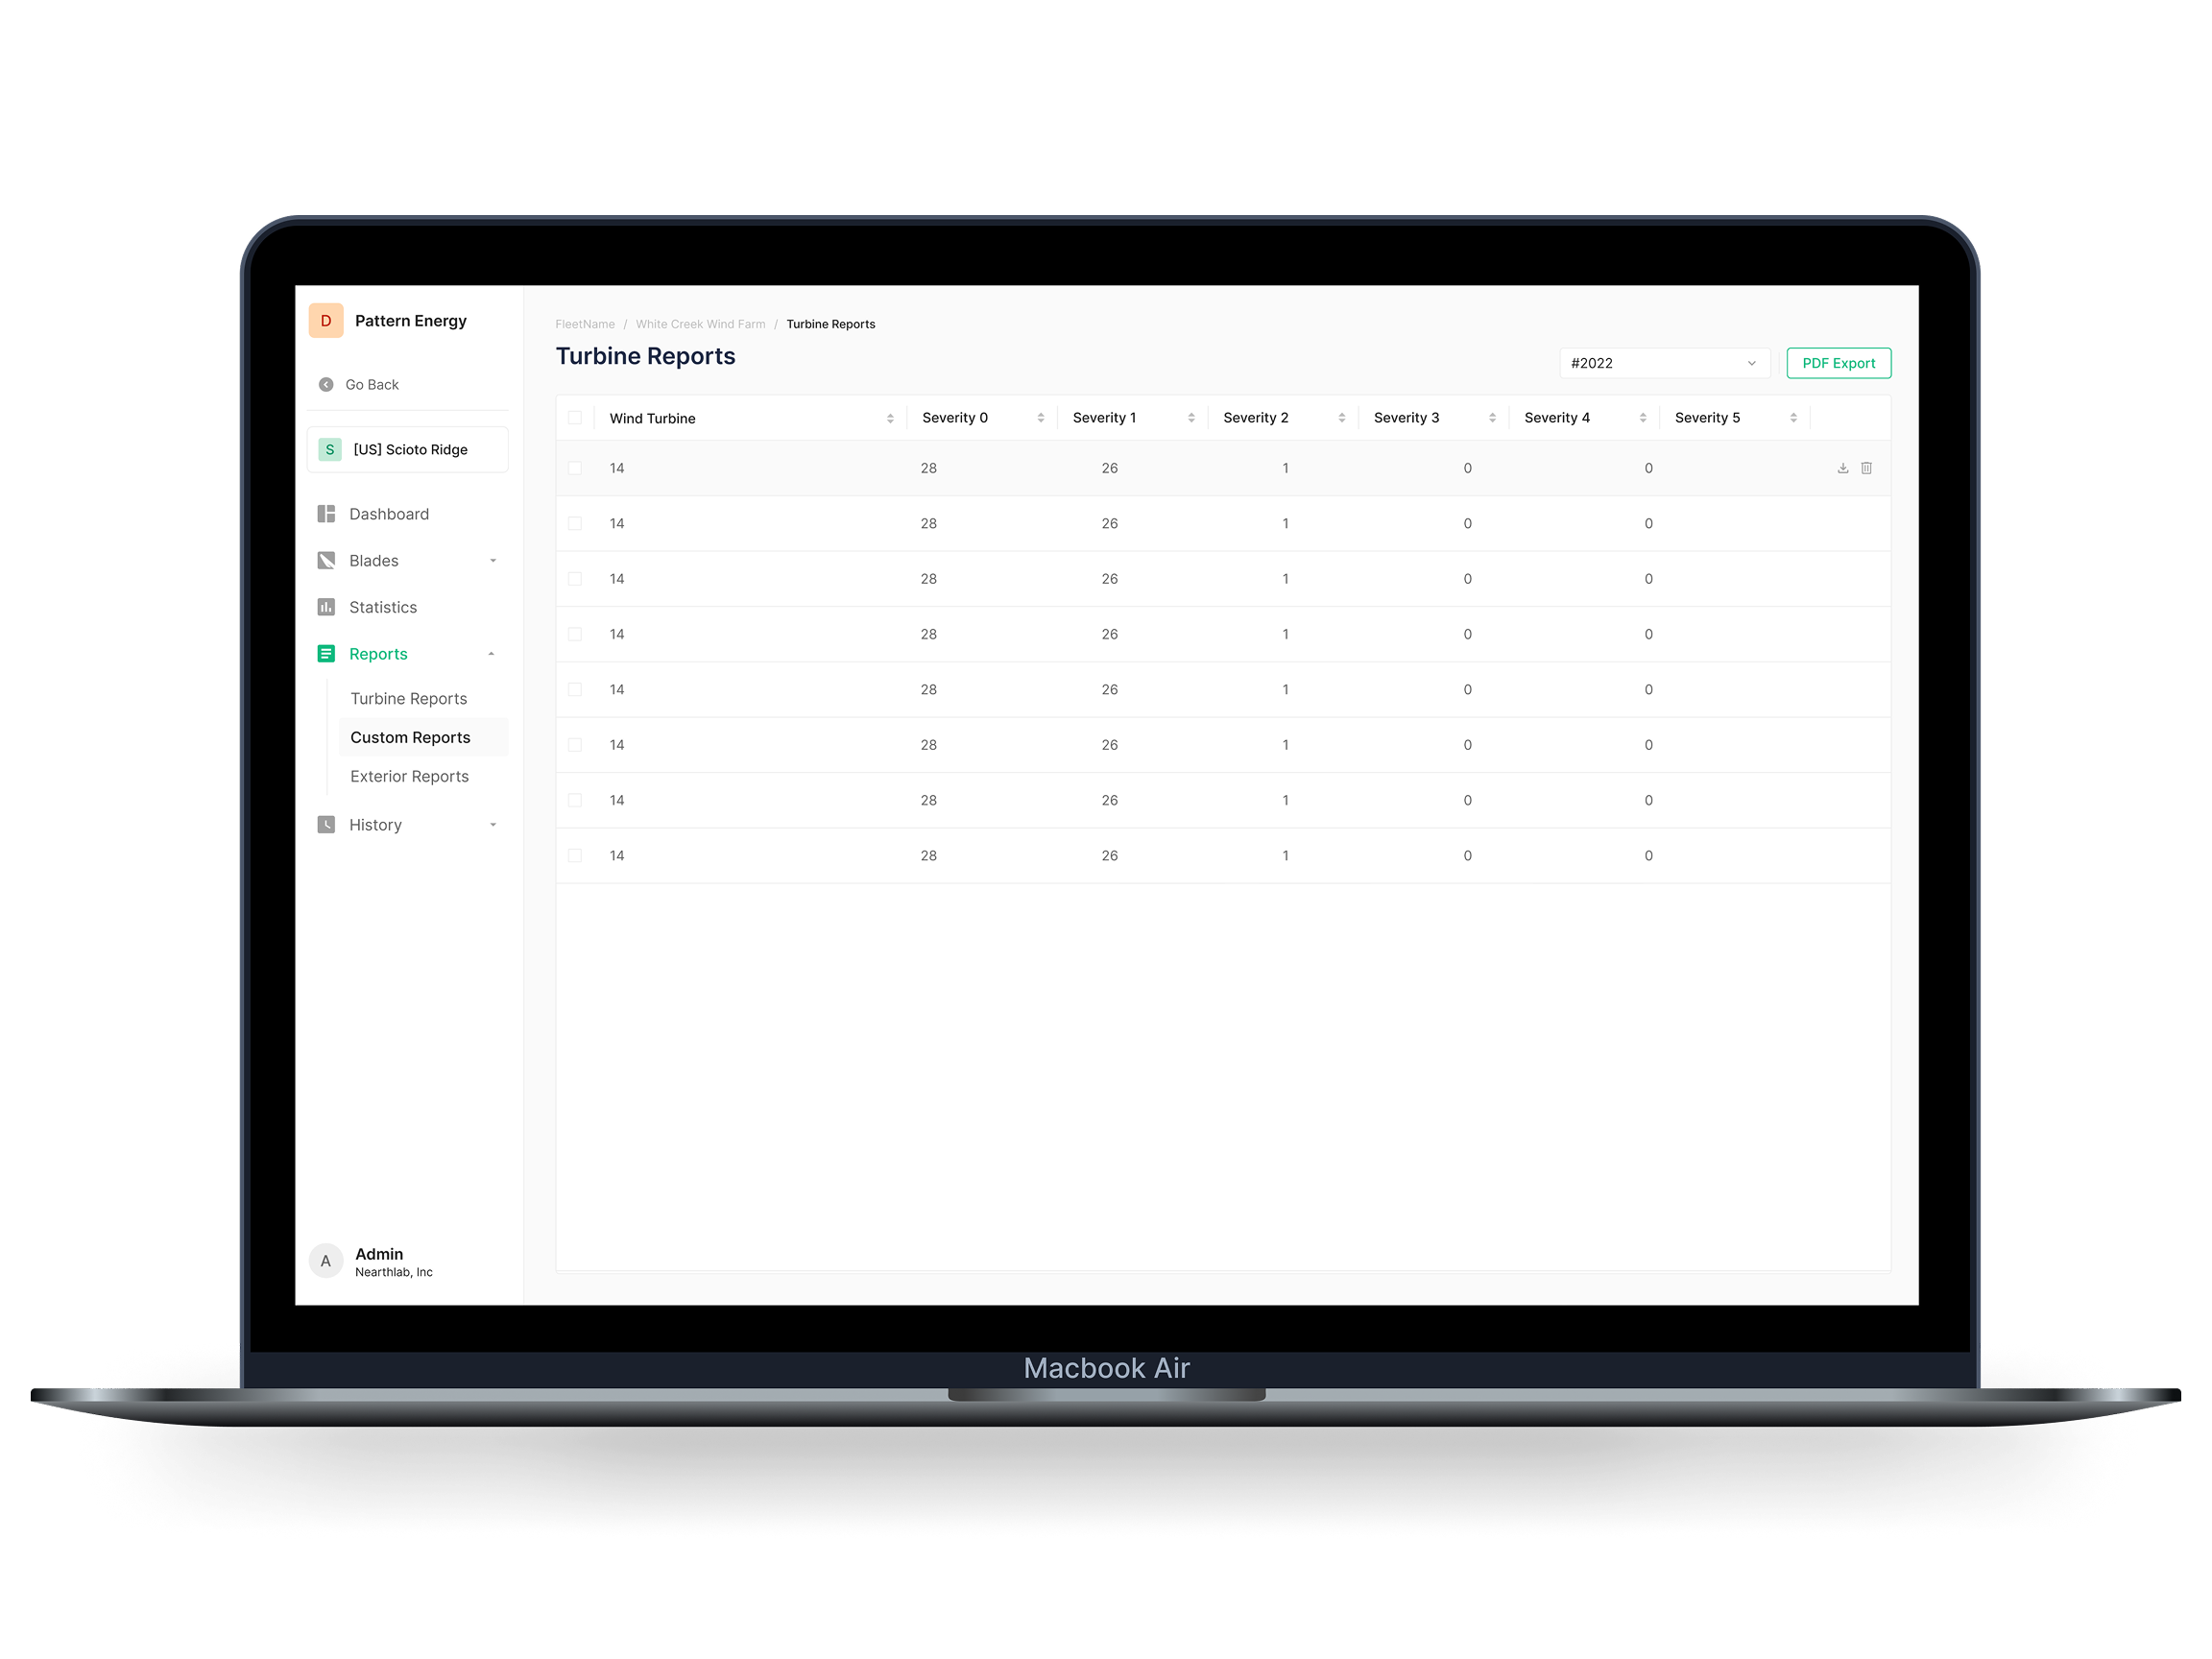
Turbine Reports
Per-turbine reports the system generates automatically when inspection completes. Sort by severity, switch ascending/descending, and download as PDF for field reporting or direct customer delivery.
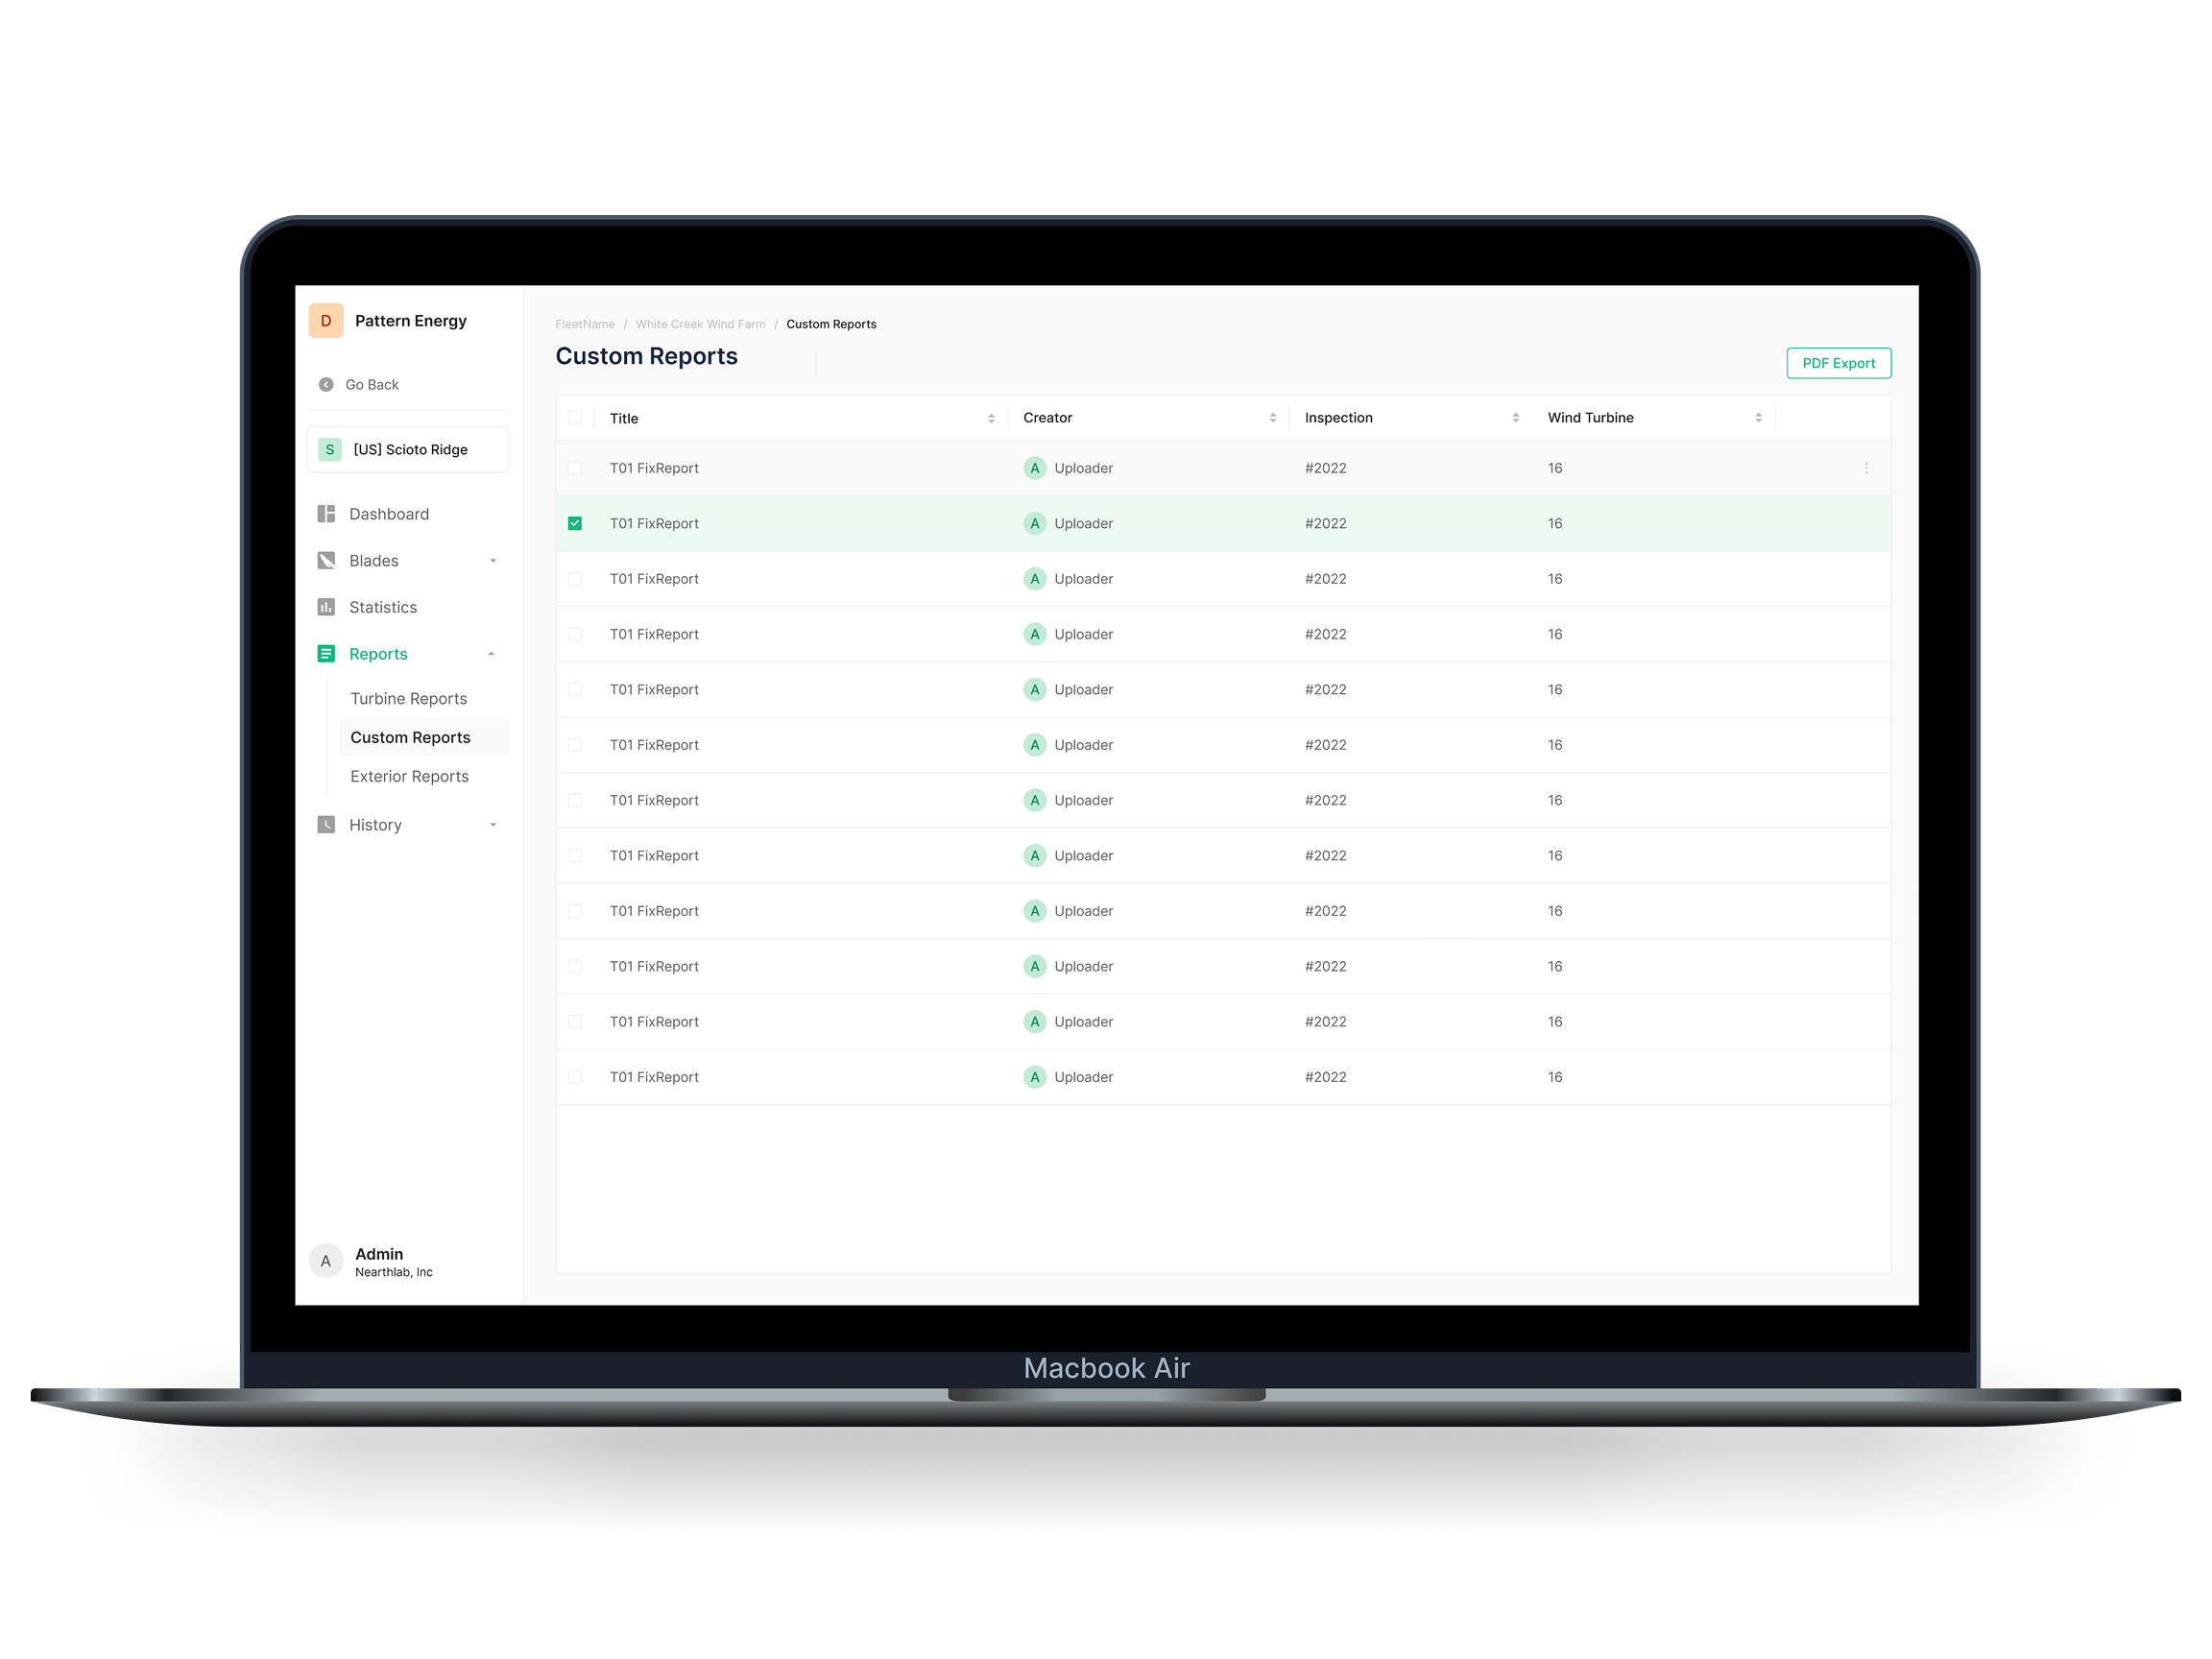
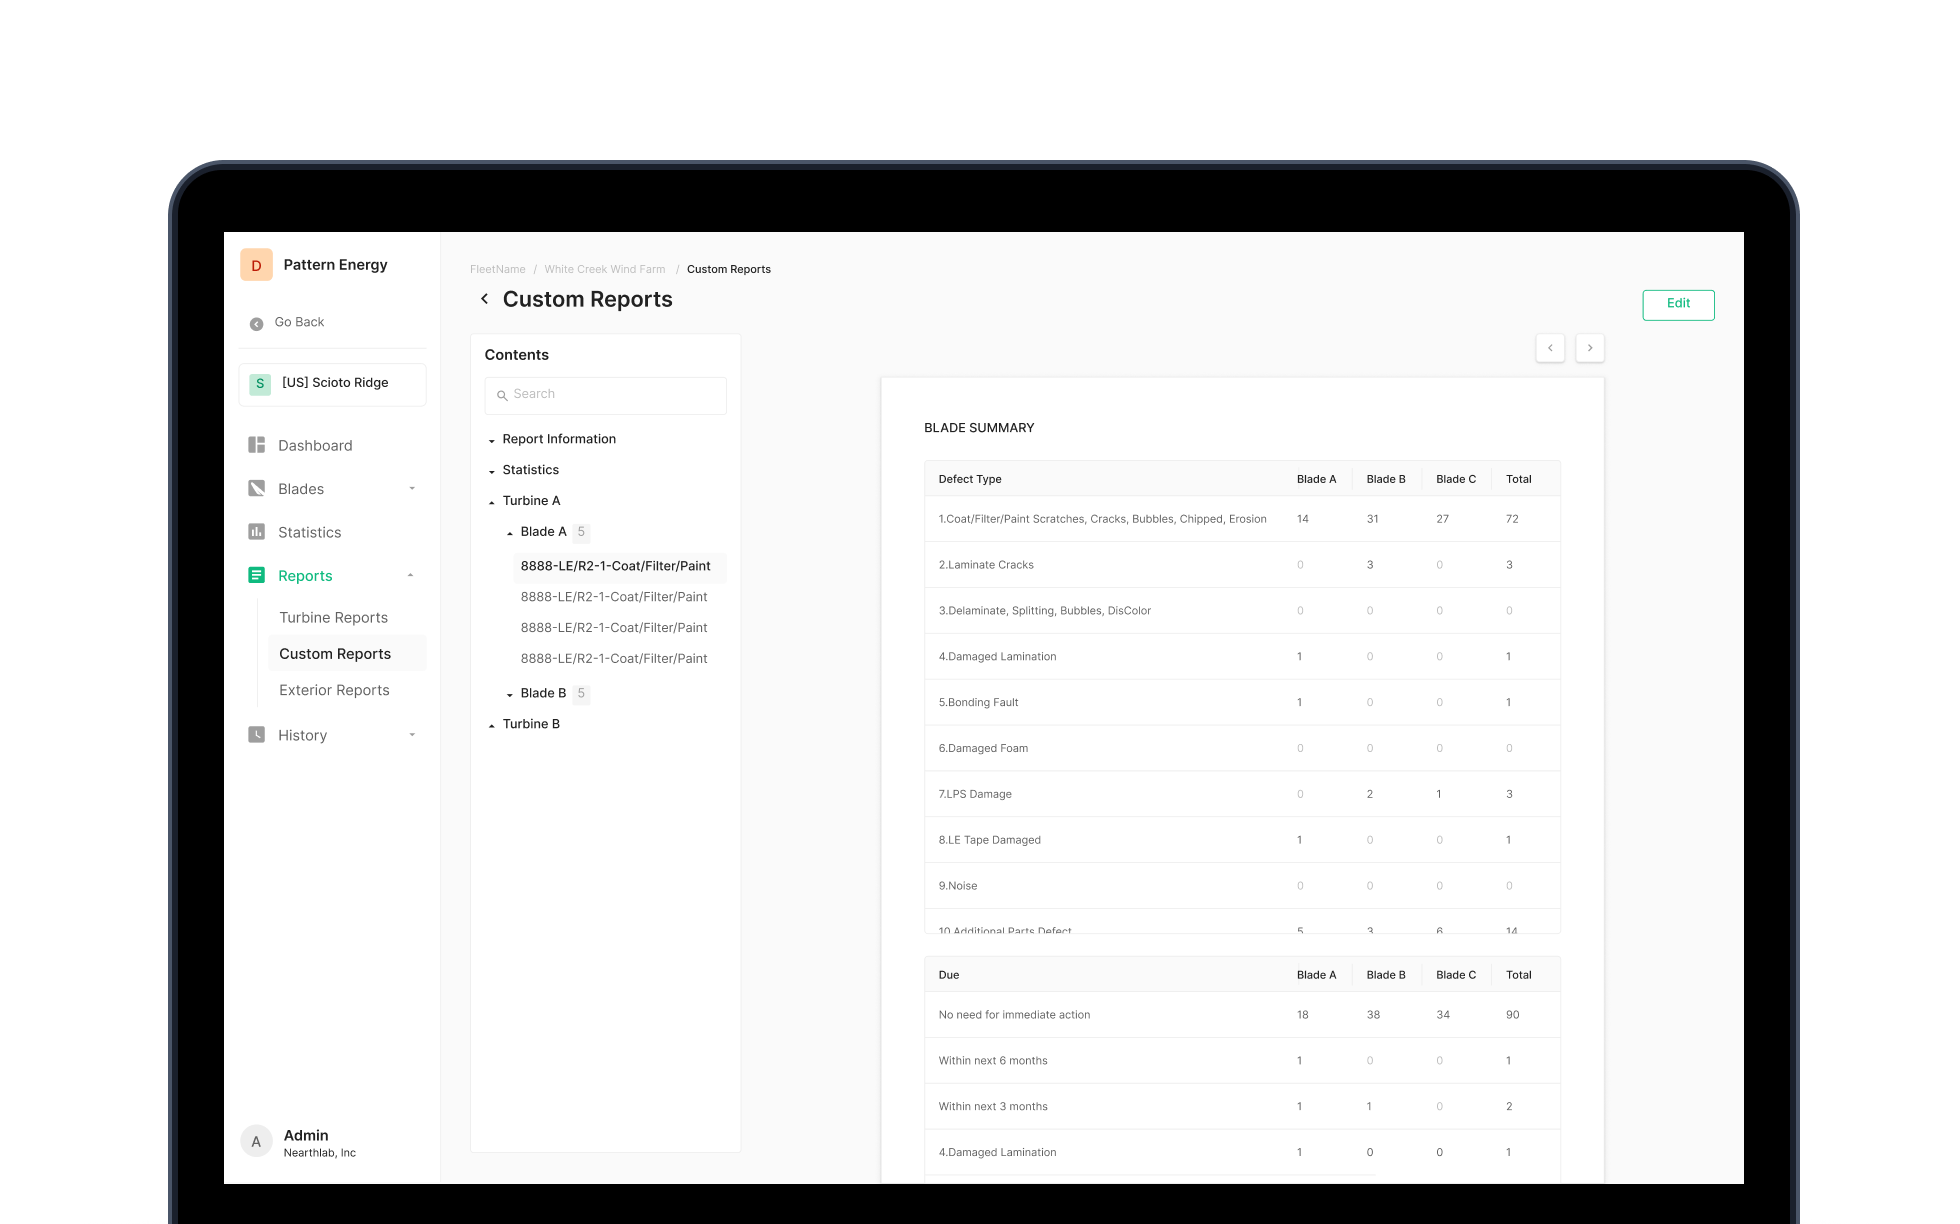
Custom Reports
Reports the user composes against their own conditions. Filter inspection data to focus on a specific period, turbine, or defect type — tailored reports follow.
Data visualization
Inspection data visualizes in graphs and charts inside the reports. Quantitative analysis comes through directly — supports maintenance planning and customer communication.
Core Feature 05
History
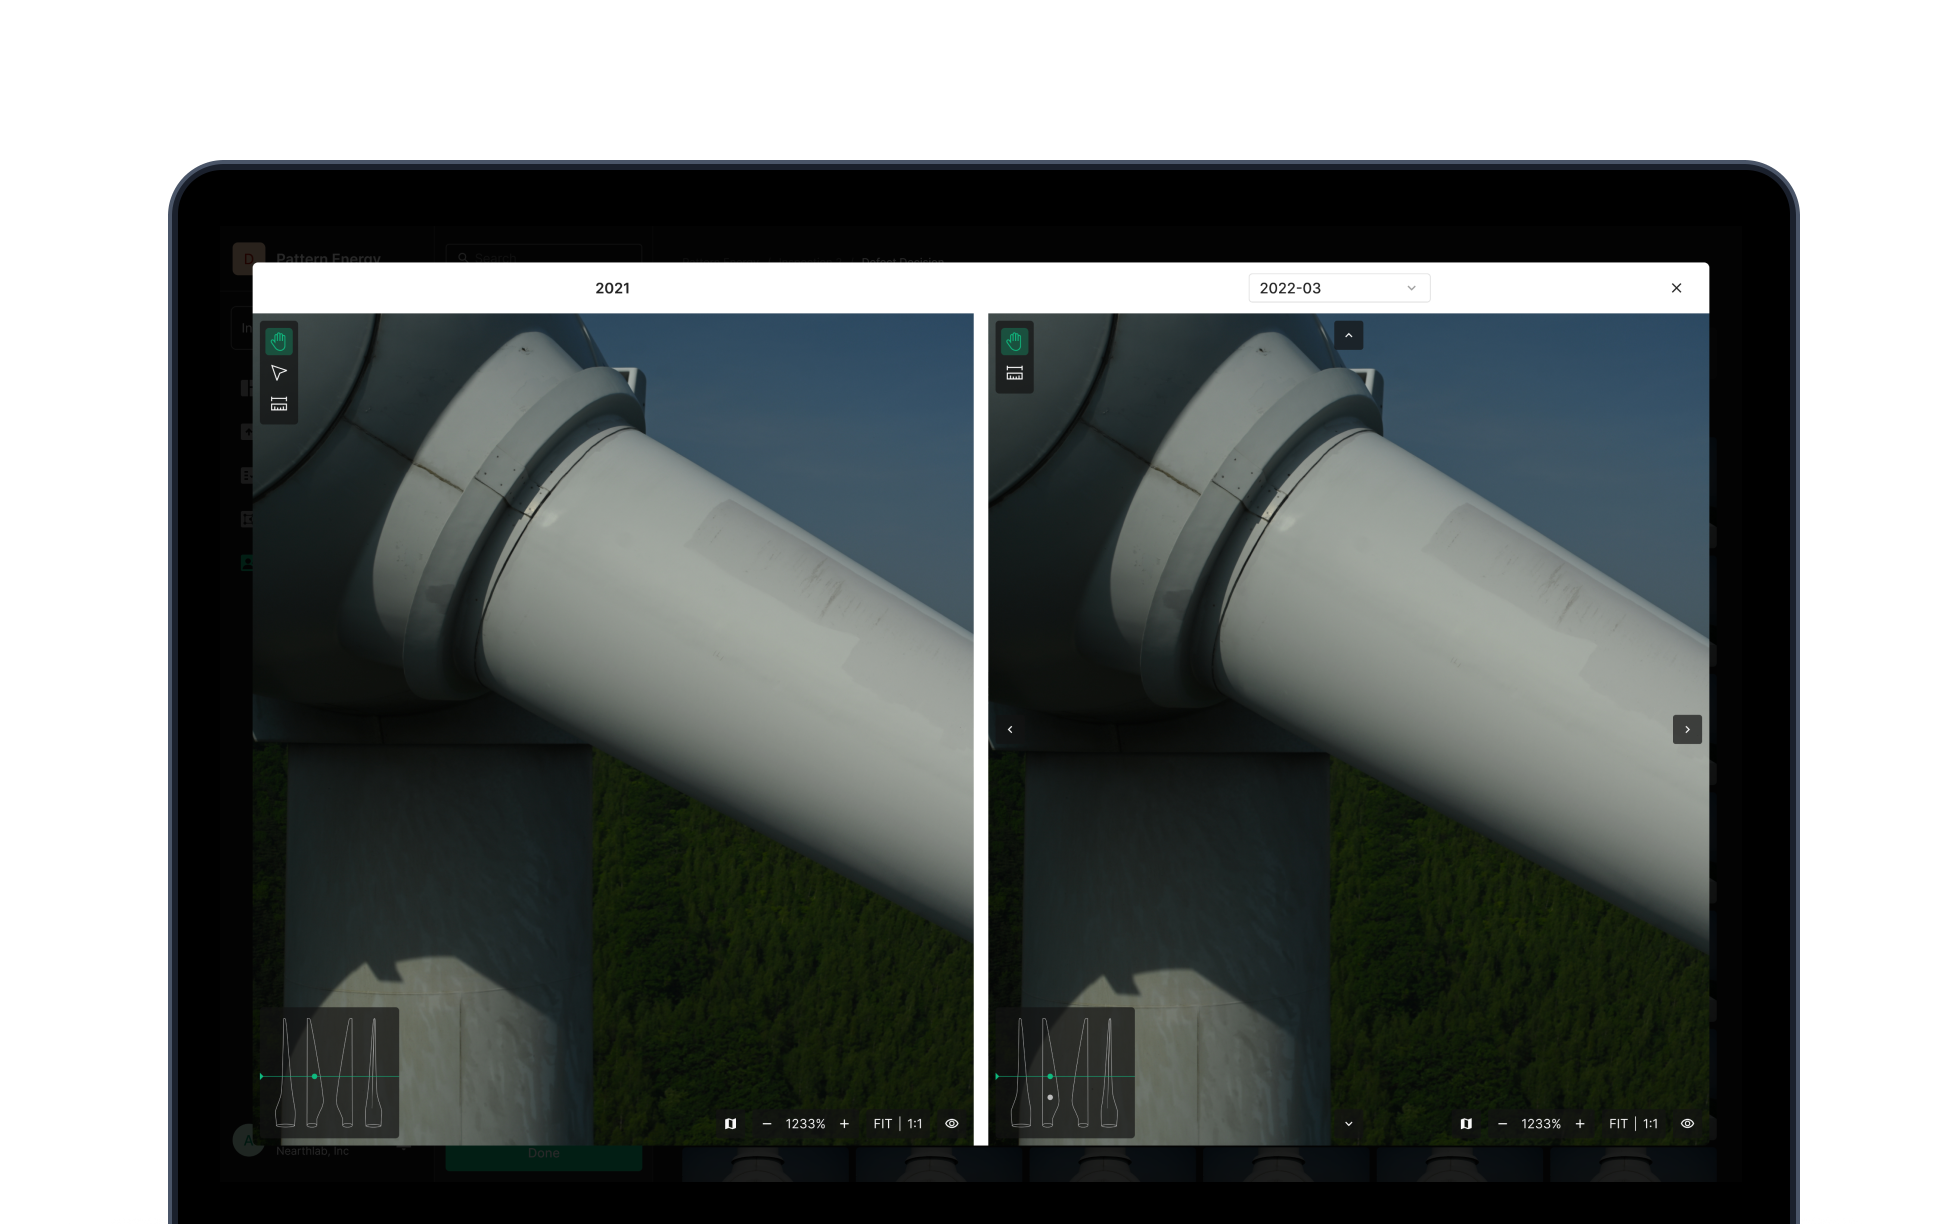
Built to track inspection records and compare results across points in time. Users place current defects next to past records to read progression, and the pattern lets them forecast where defects show up next. Not an archive — a prediction tool for maintenance decisions.
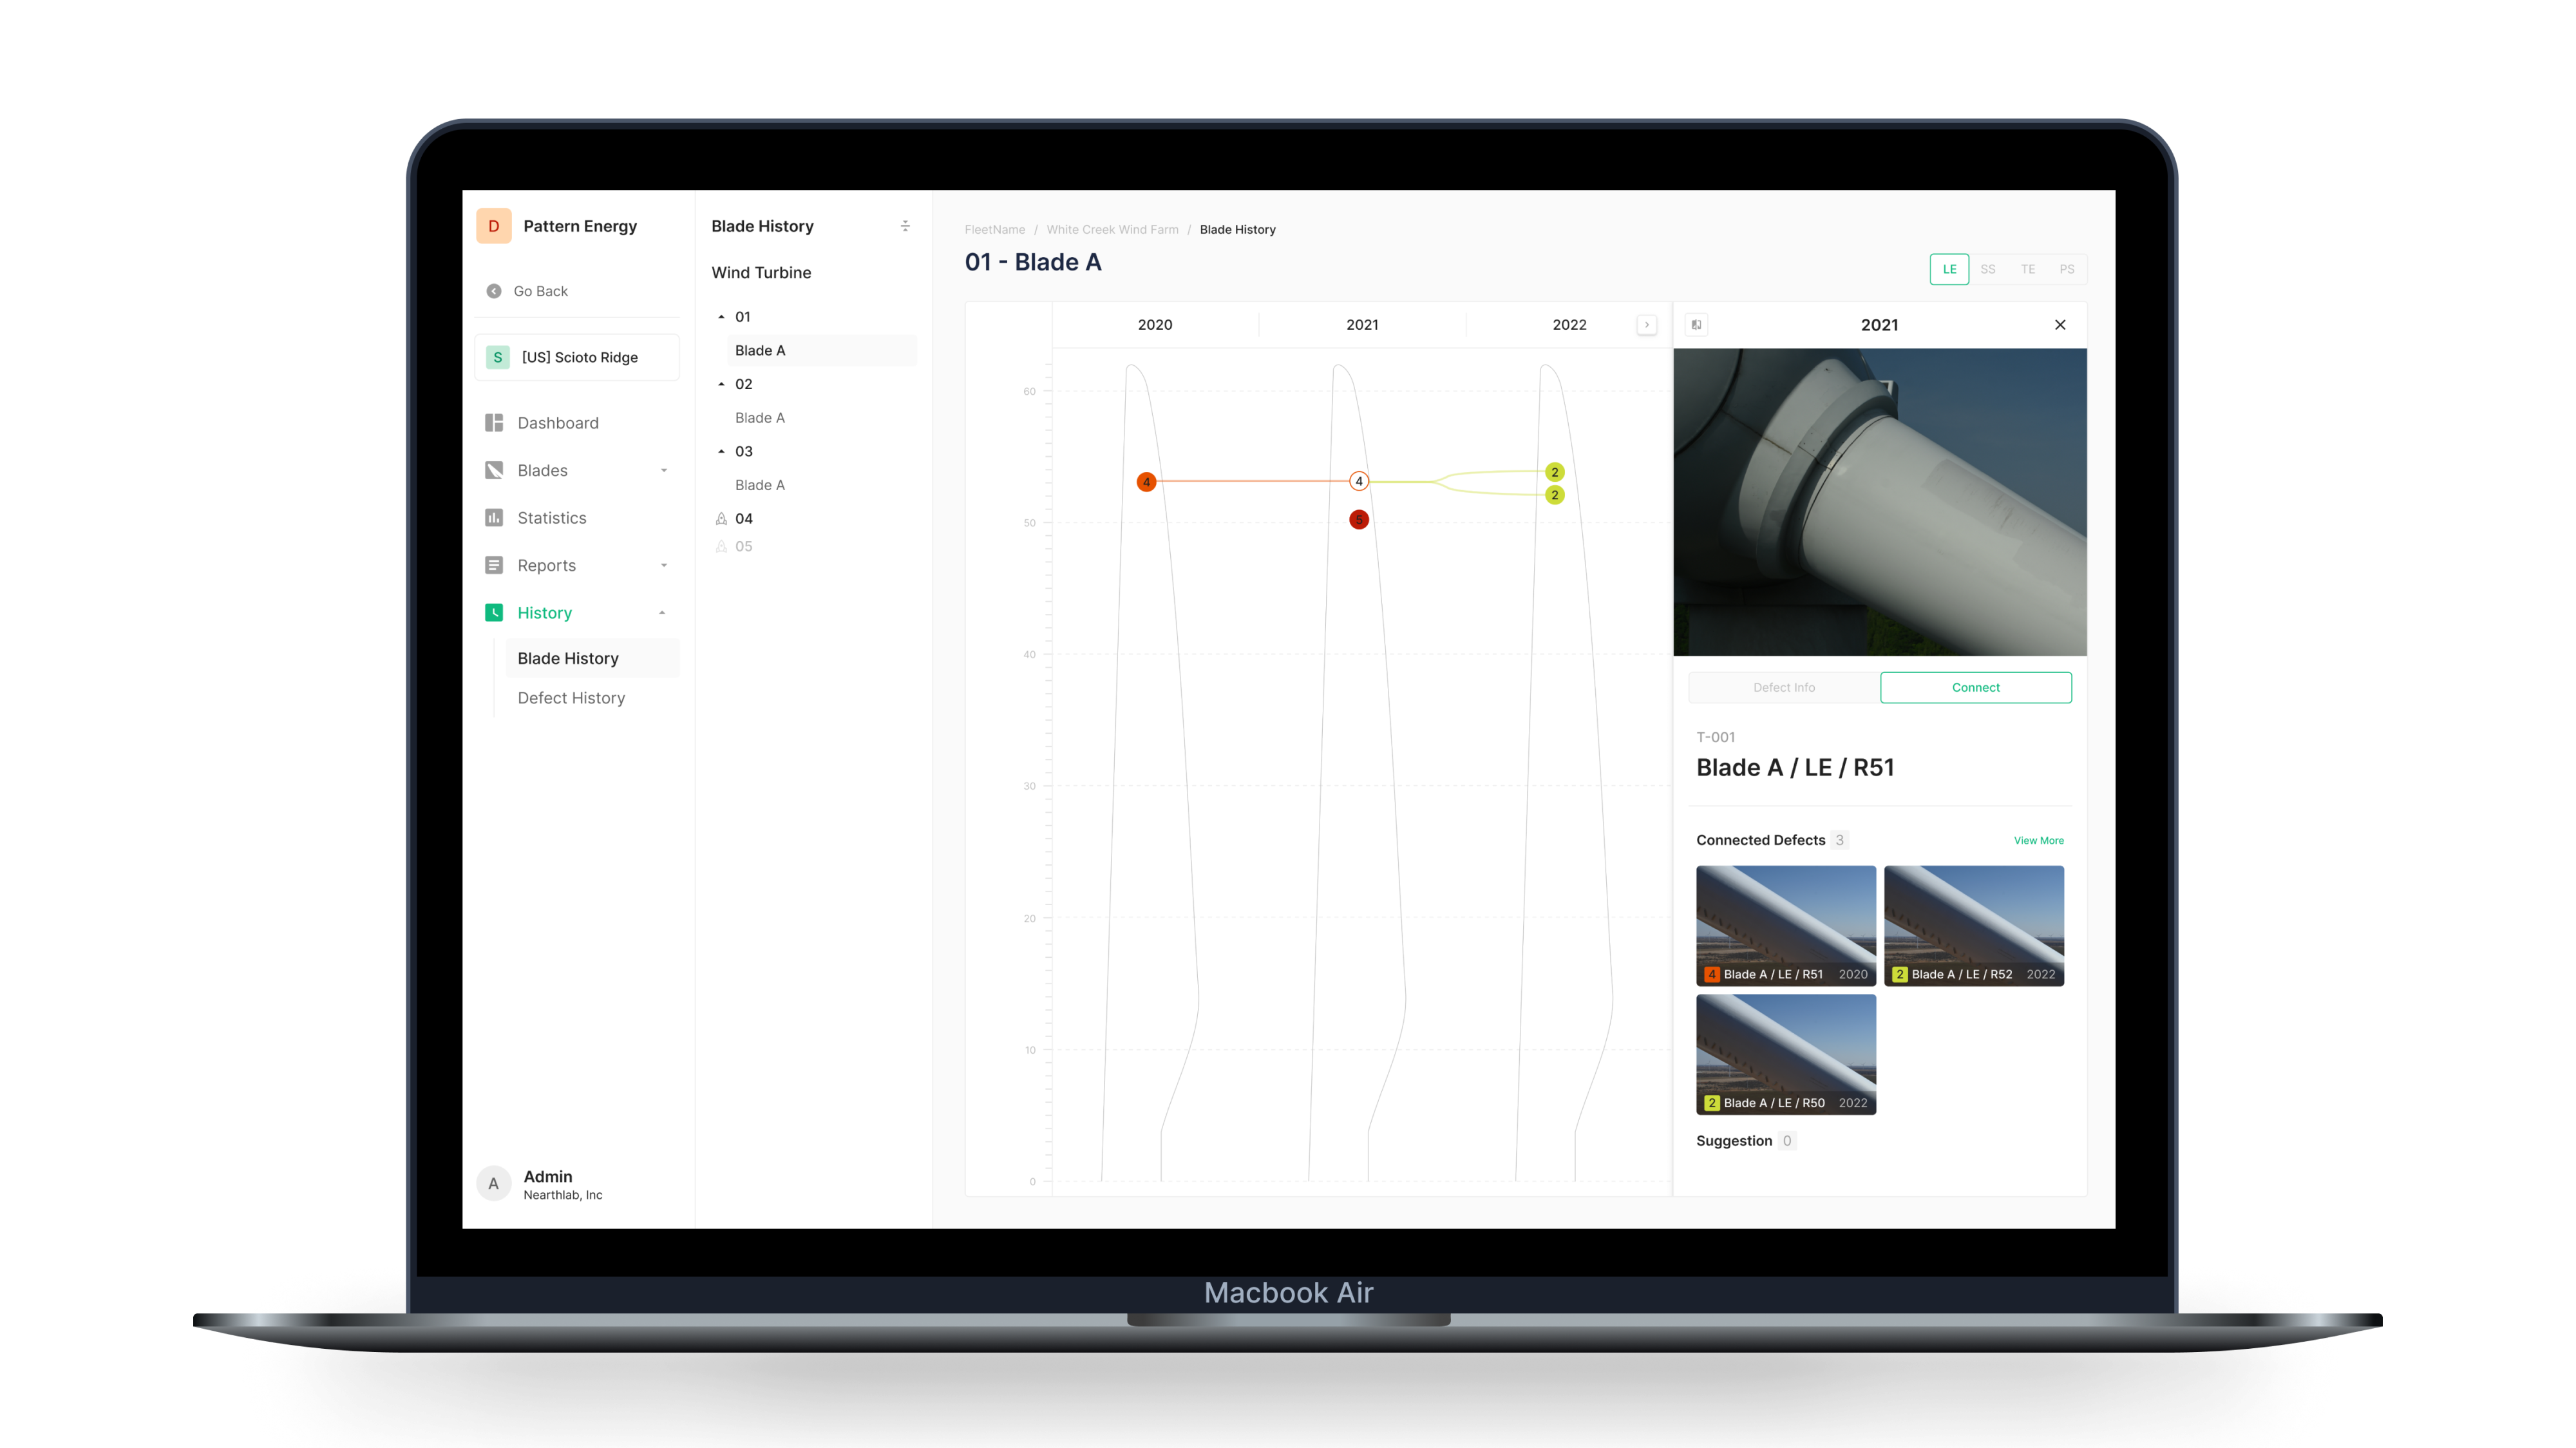
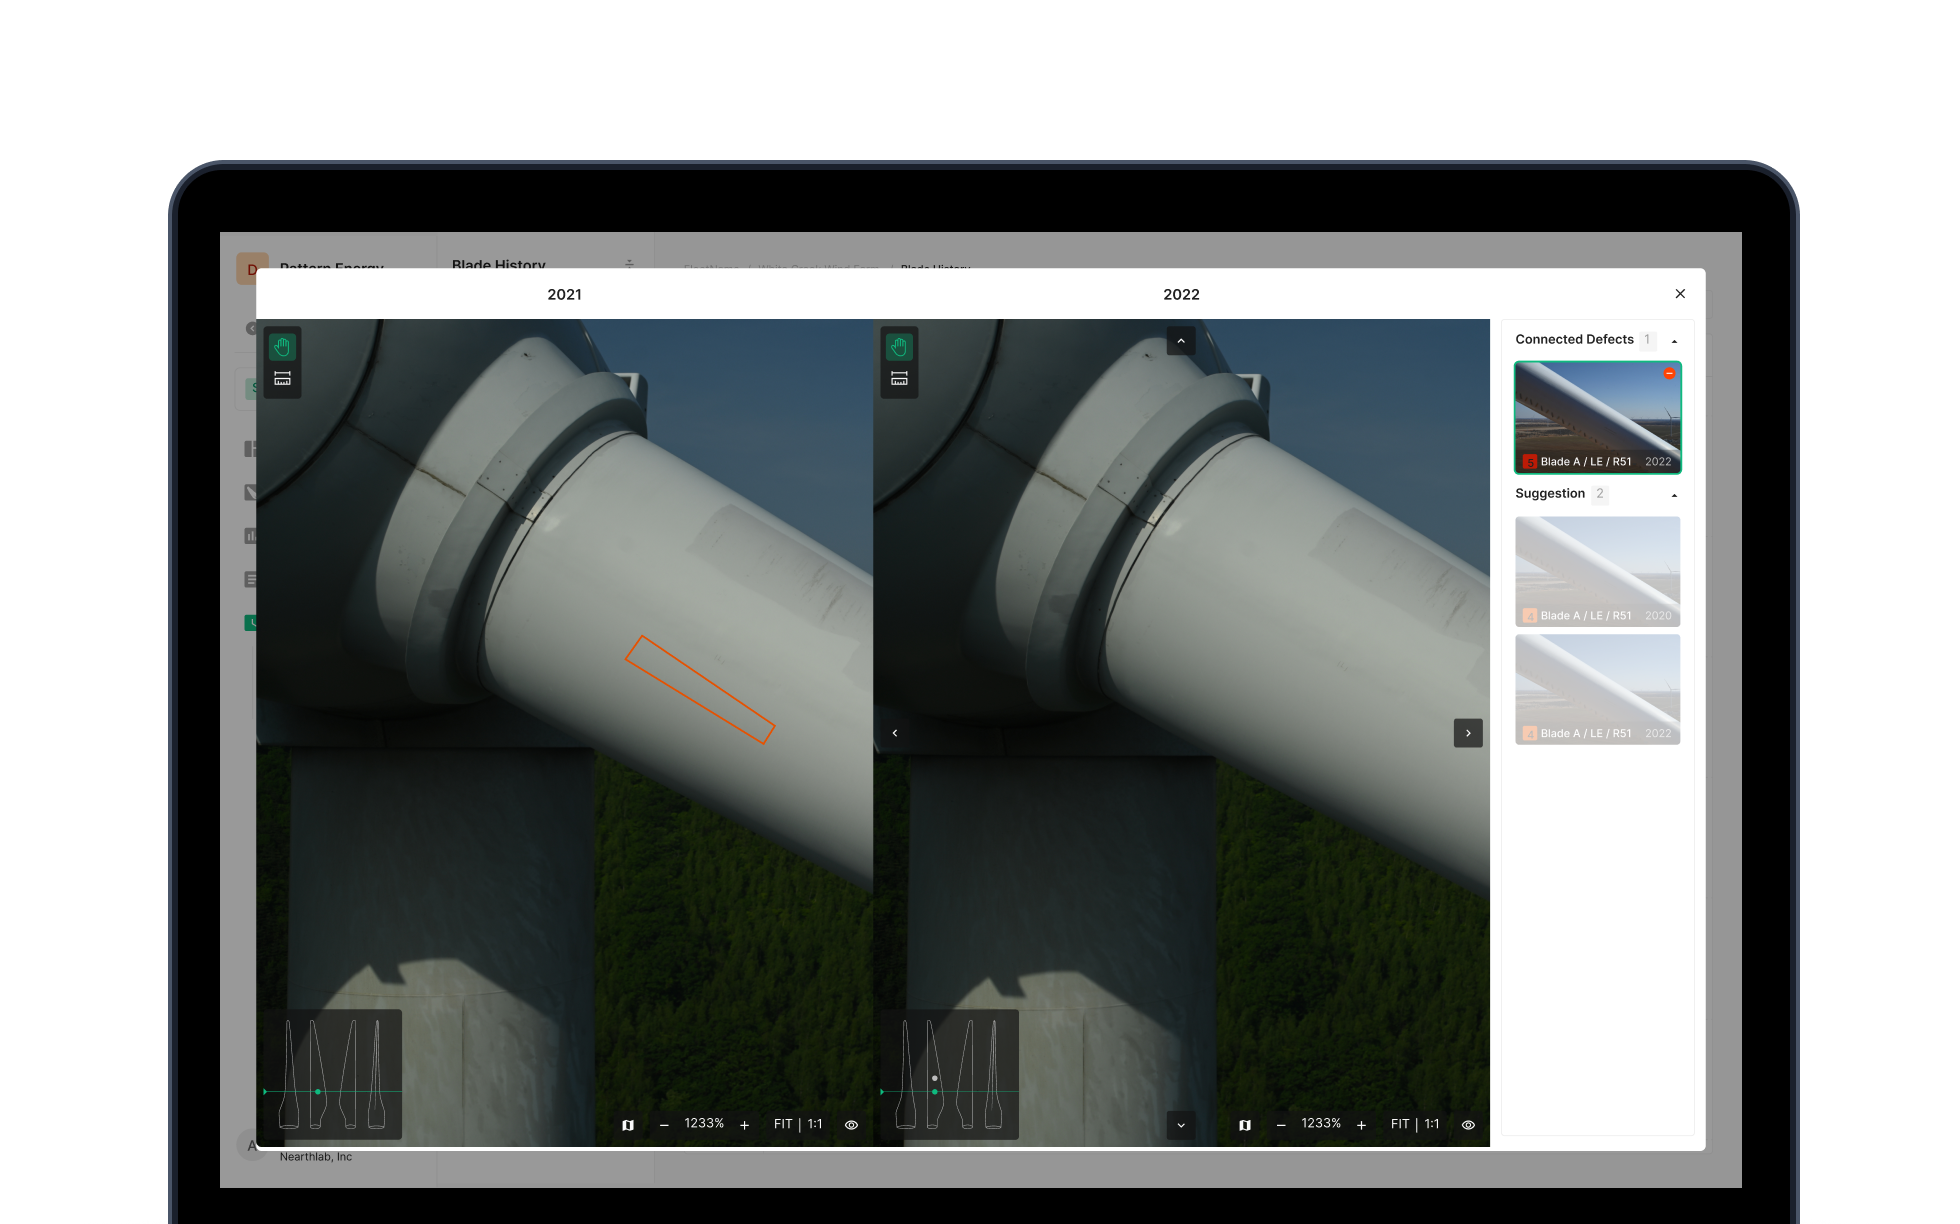
Blade History
Visualizes per-face blade inspection records by year. Pick a turbine and blade — defect positions surface on the diagram, and same-defect connecting lines make time-based progression intuitive.
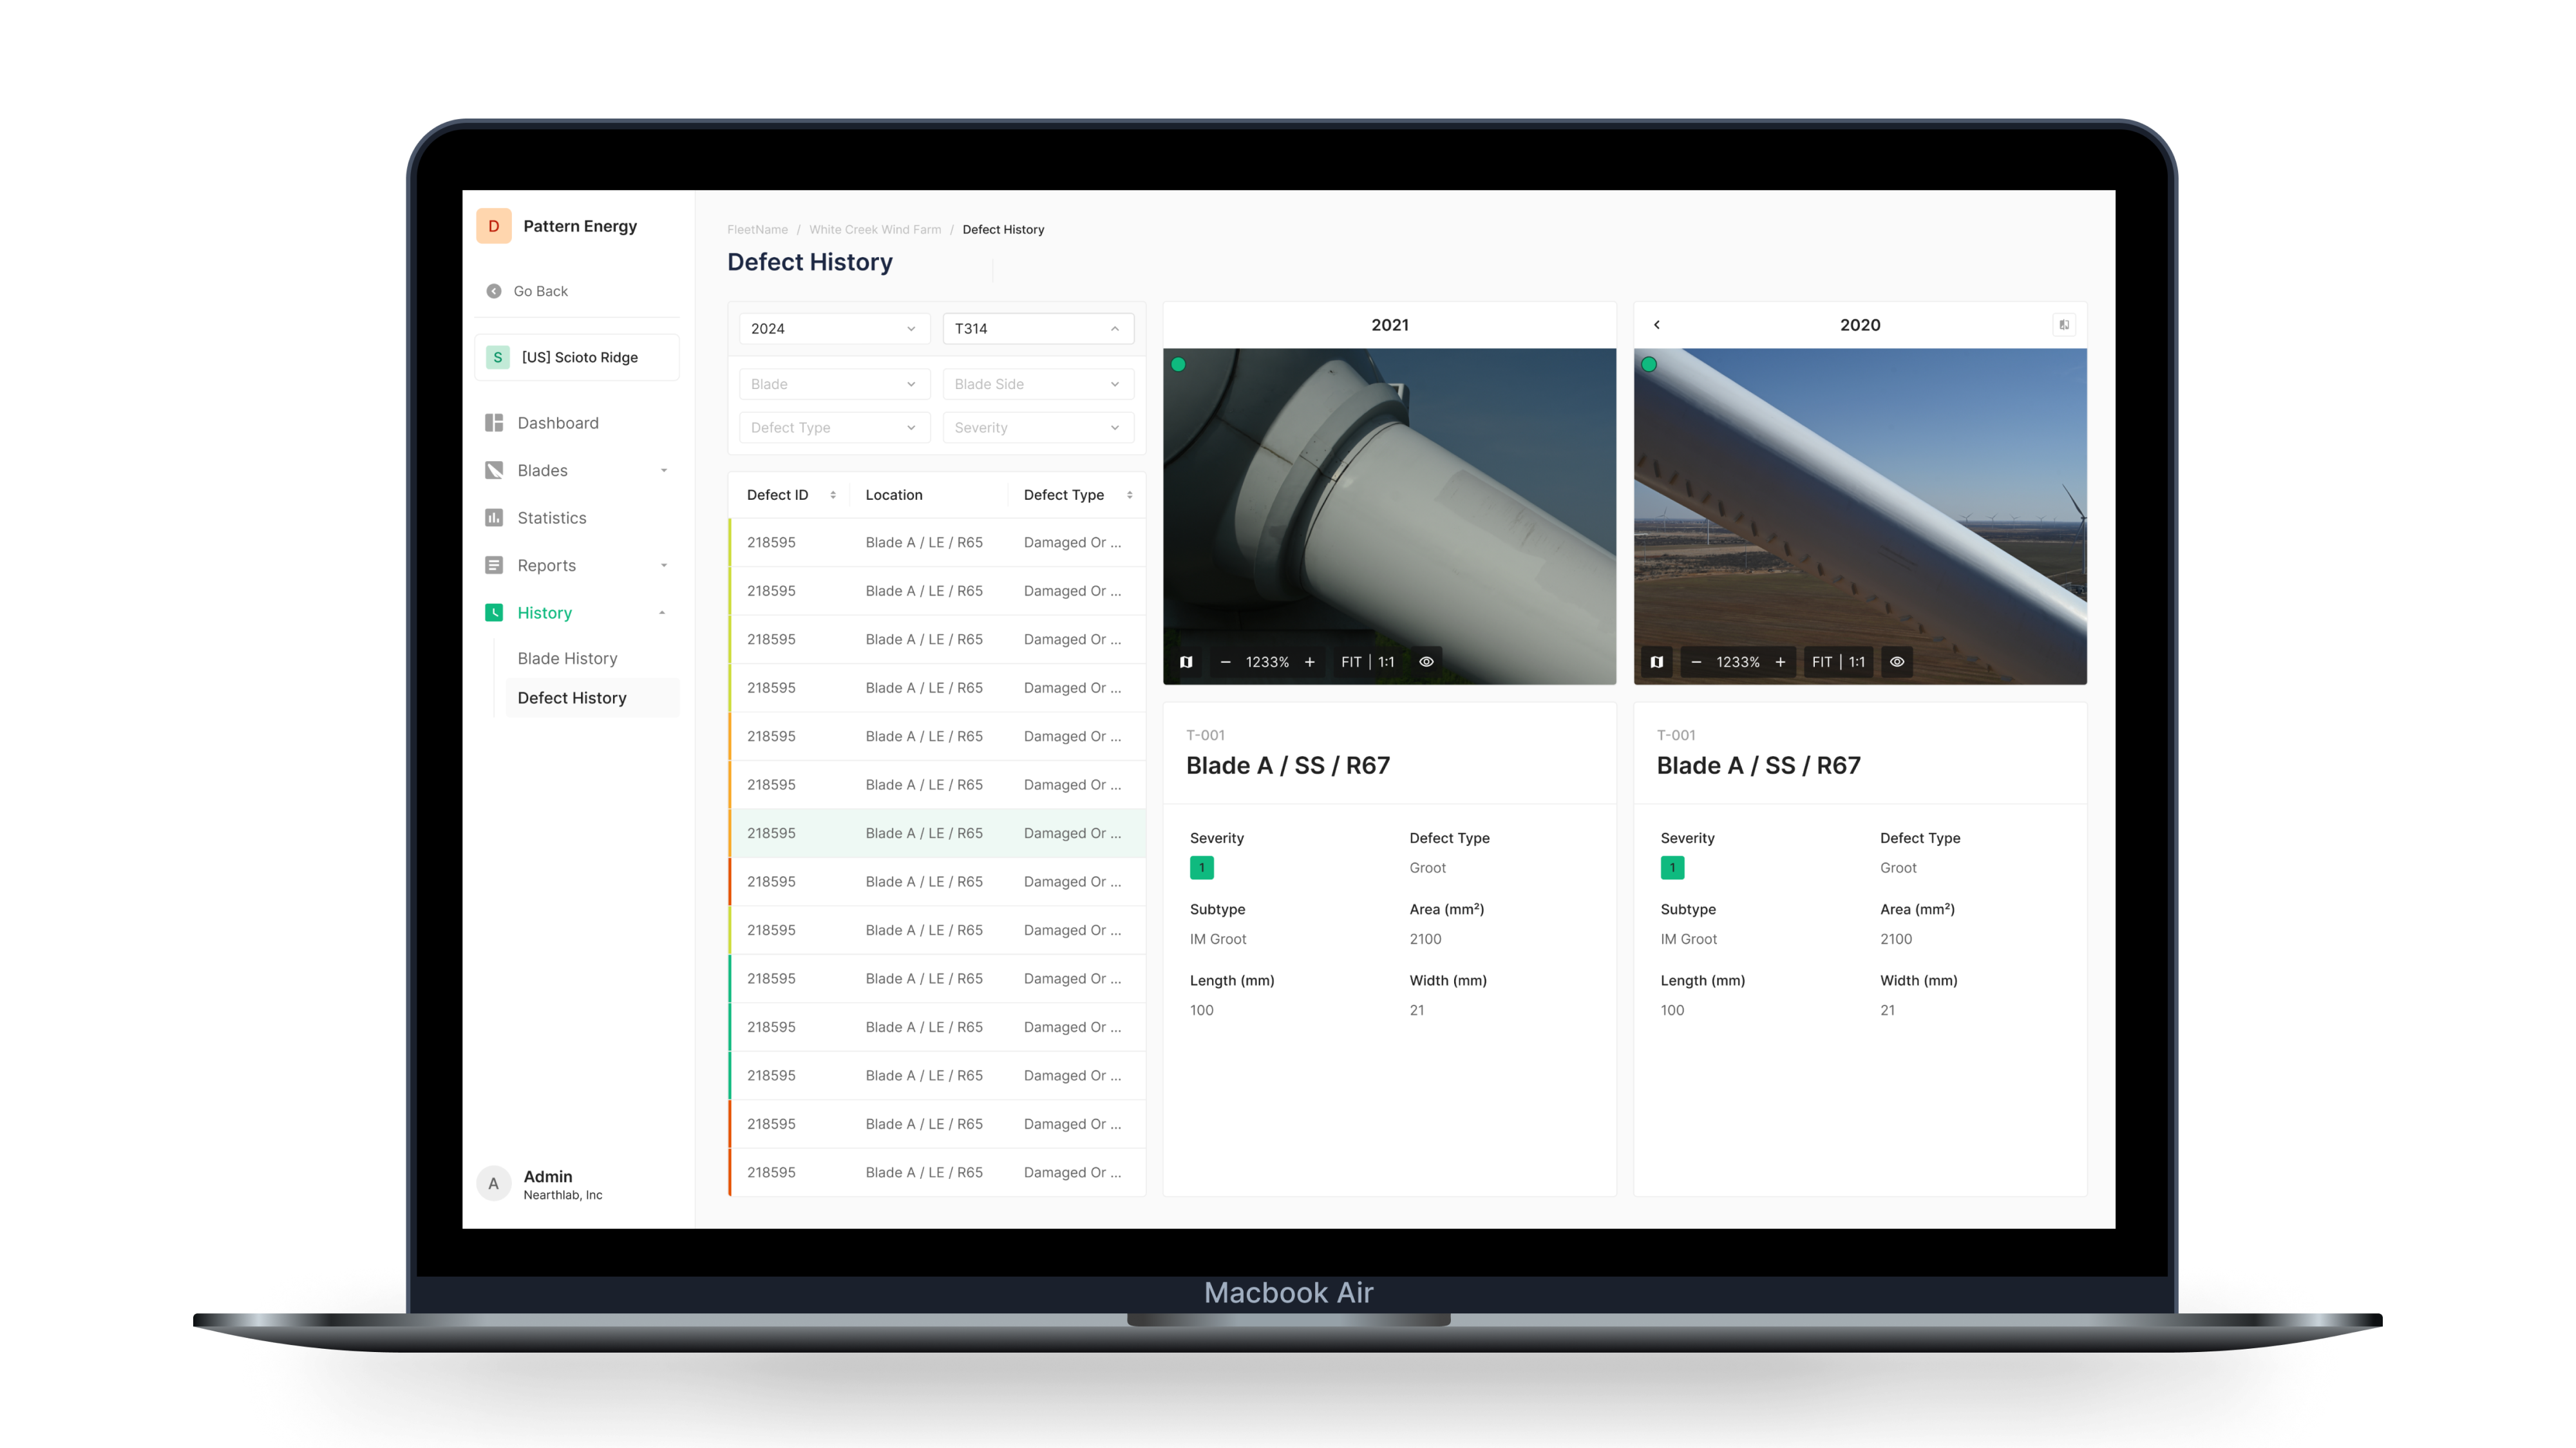
Defect History
Filter to read detailed defect history. Inspection ID, turbine, blade, blade face, defect type, and severity filters surface a specific defect's full history and detail.
Predictive management
Compare past and present defects to read where the problem is heading. Pattern analysis of defect records forecasts future occurrences — and enables proactive maintenance planning.
Core Feature 06
Management
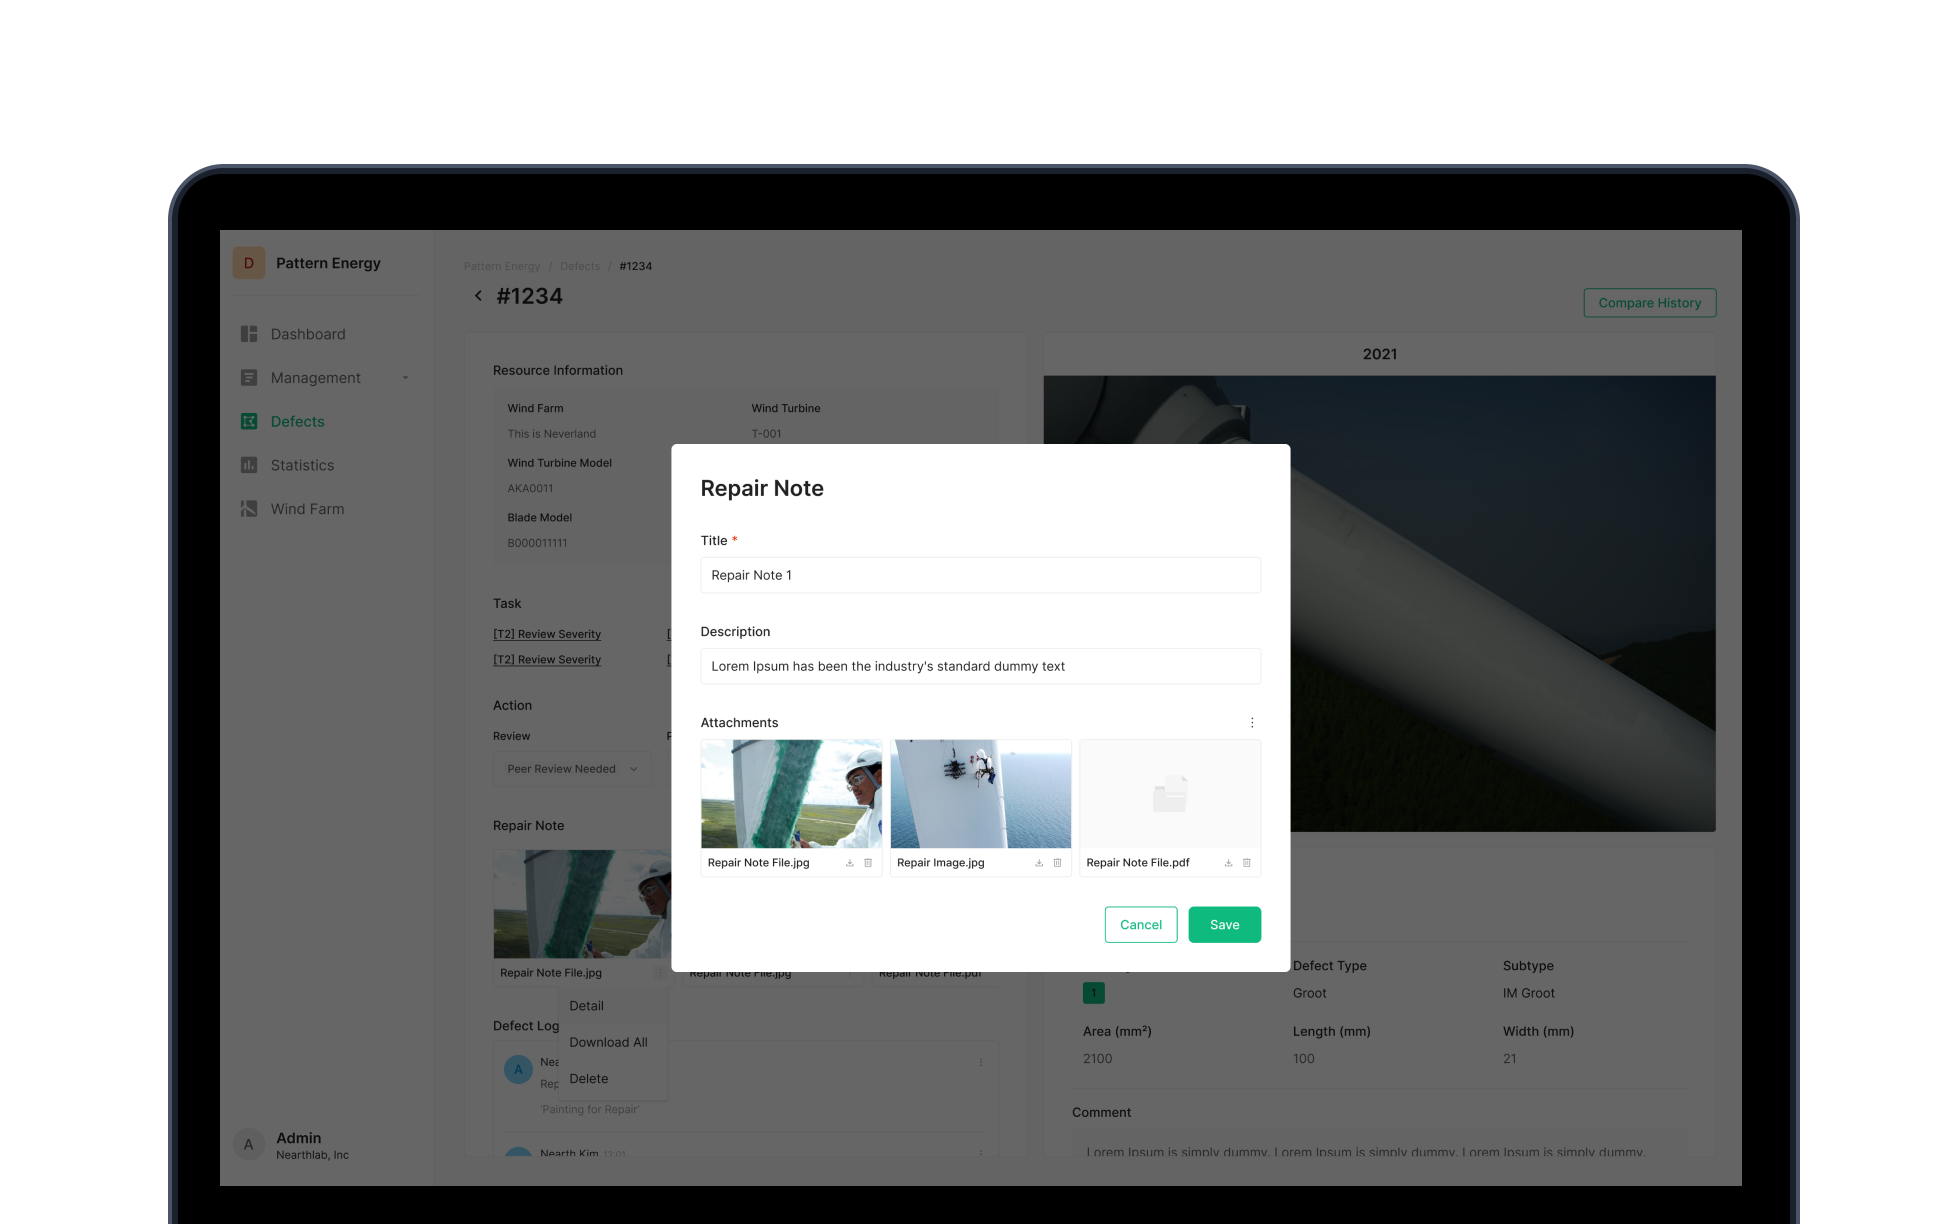
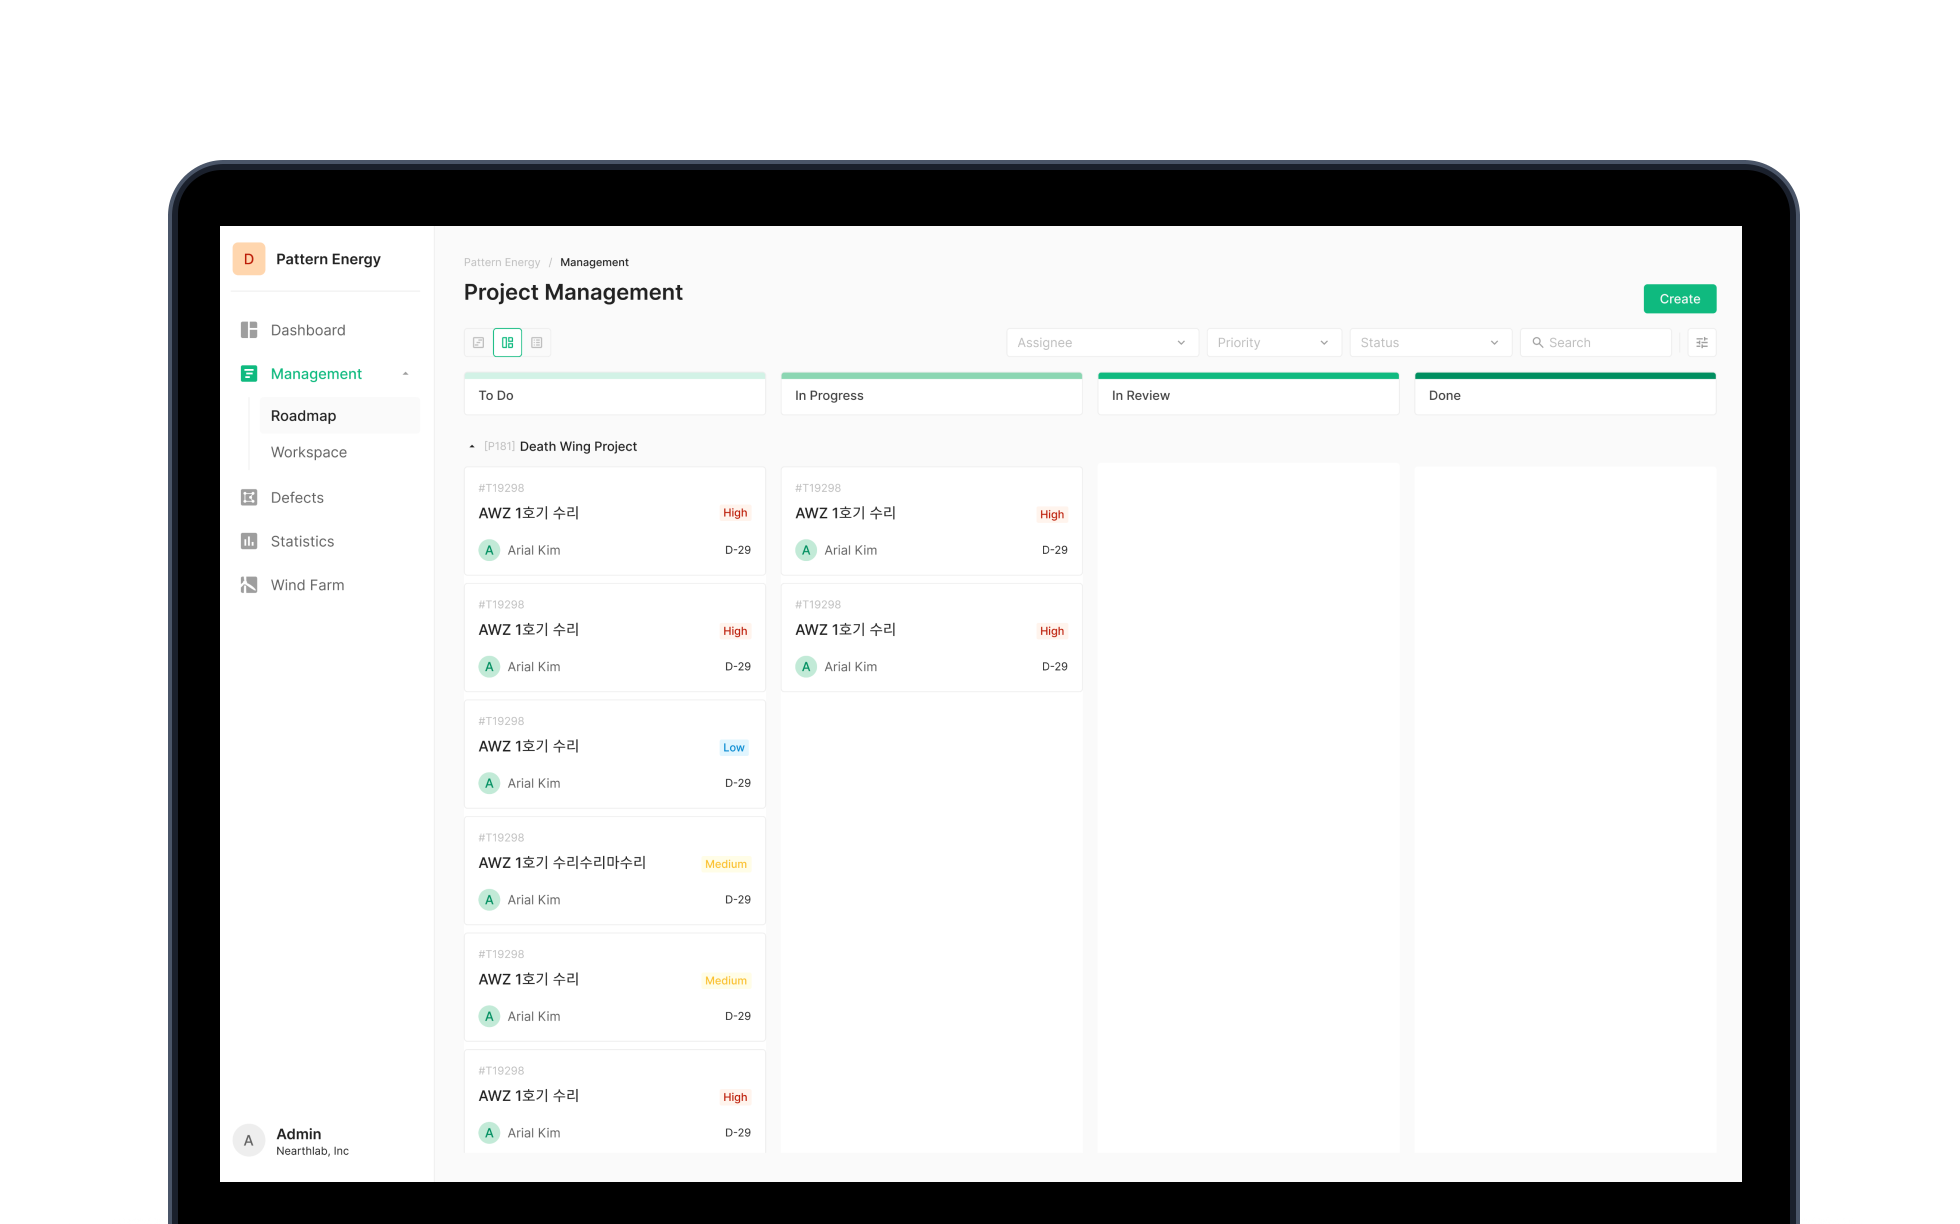
Inspection results aren't the end — this module connects the work through to the repair. A project- and task-based workspace systematizes post-inspection follow-up and shares progress with the team.
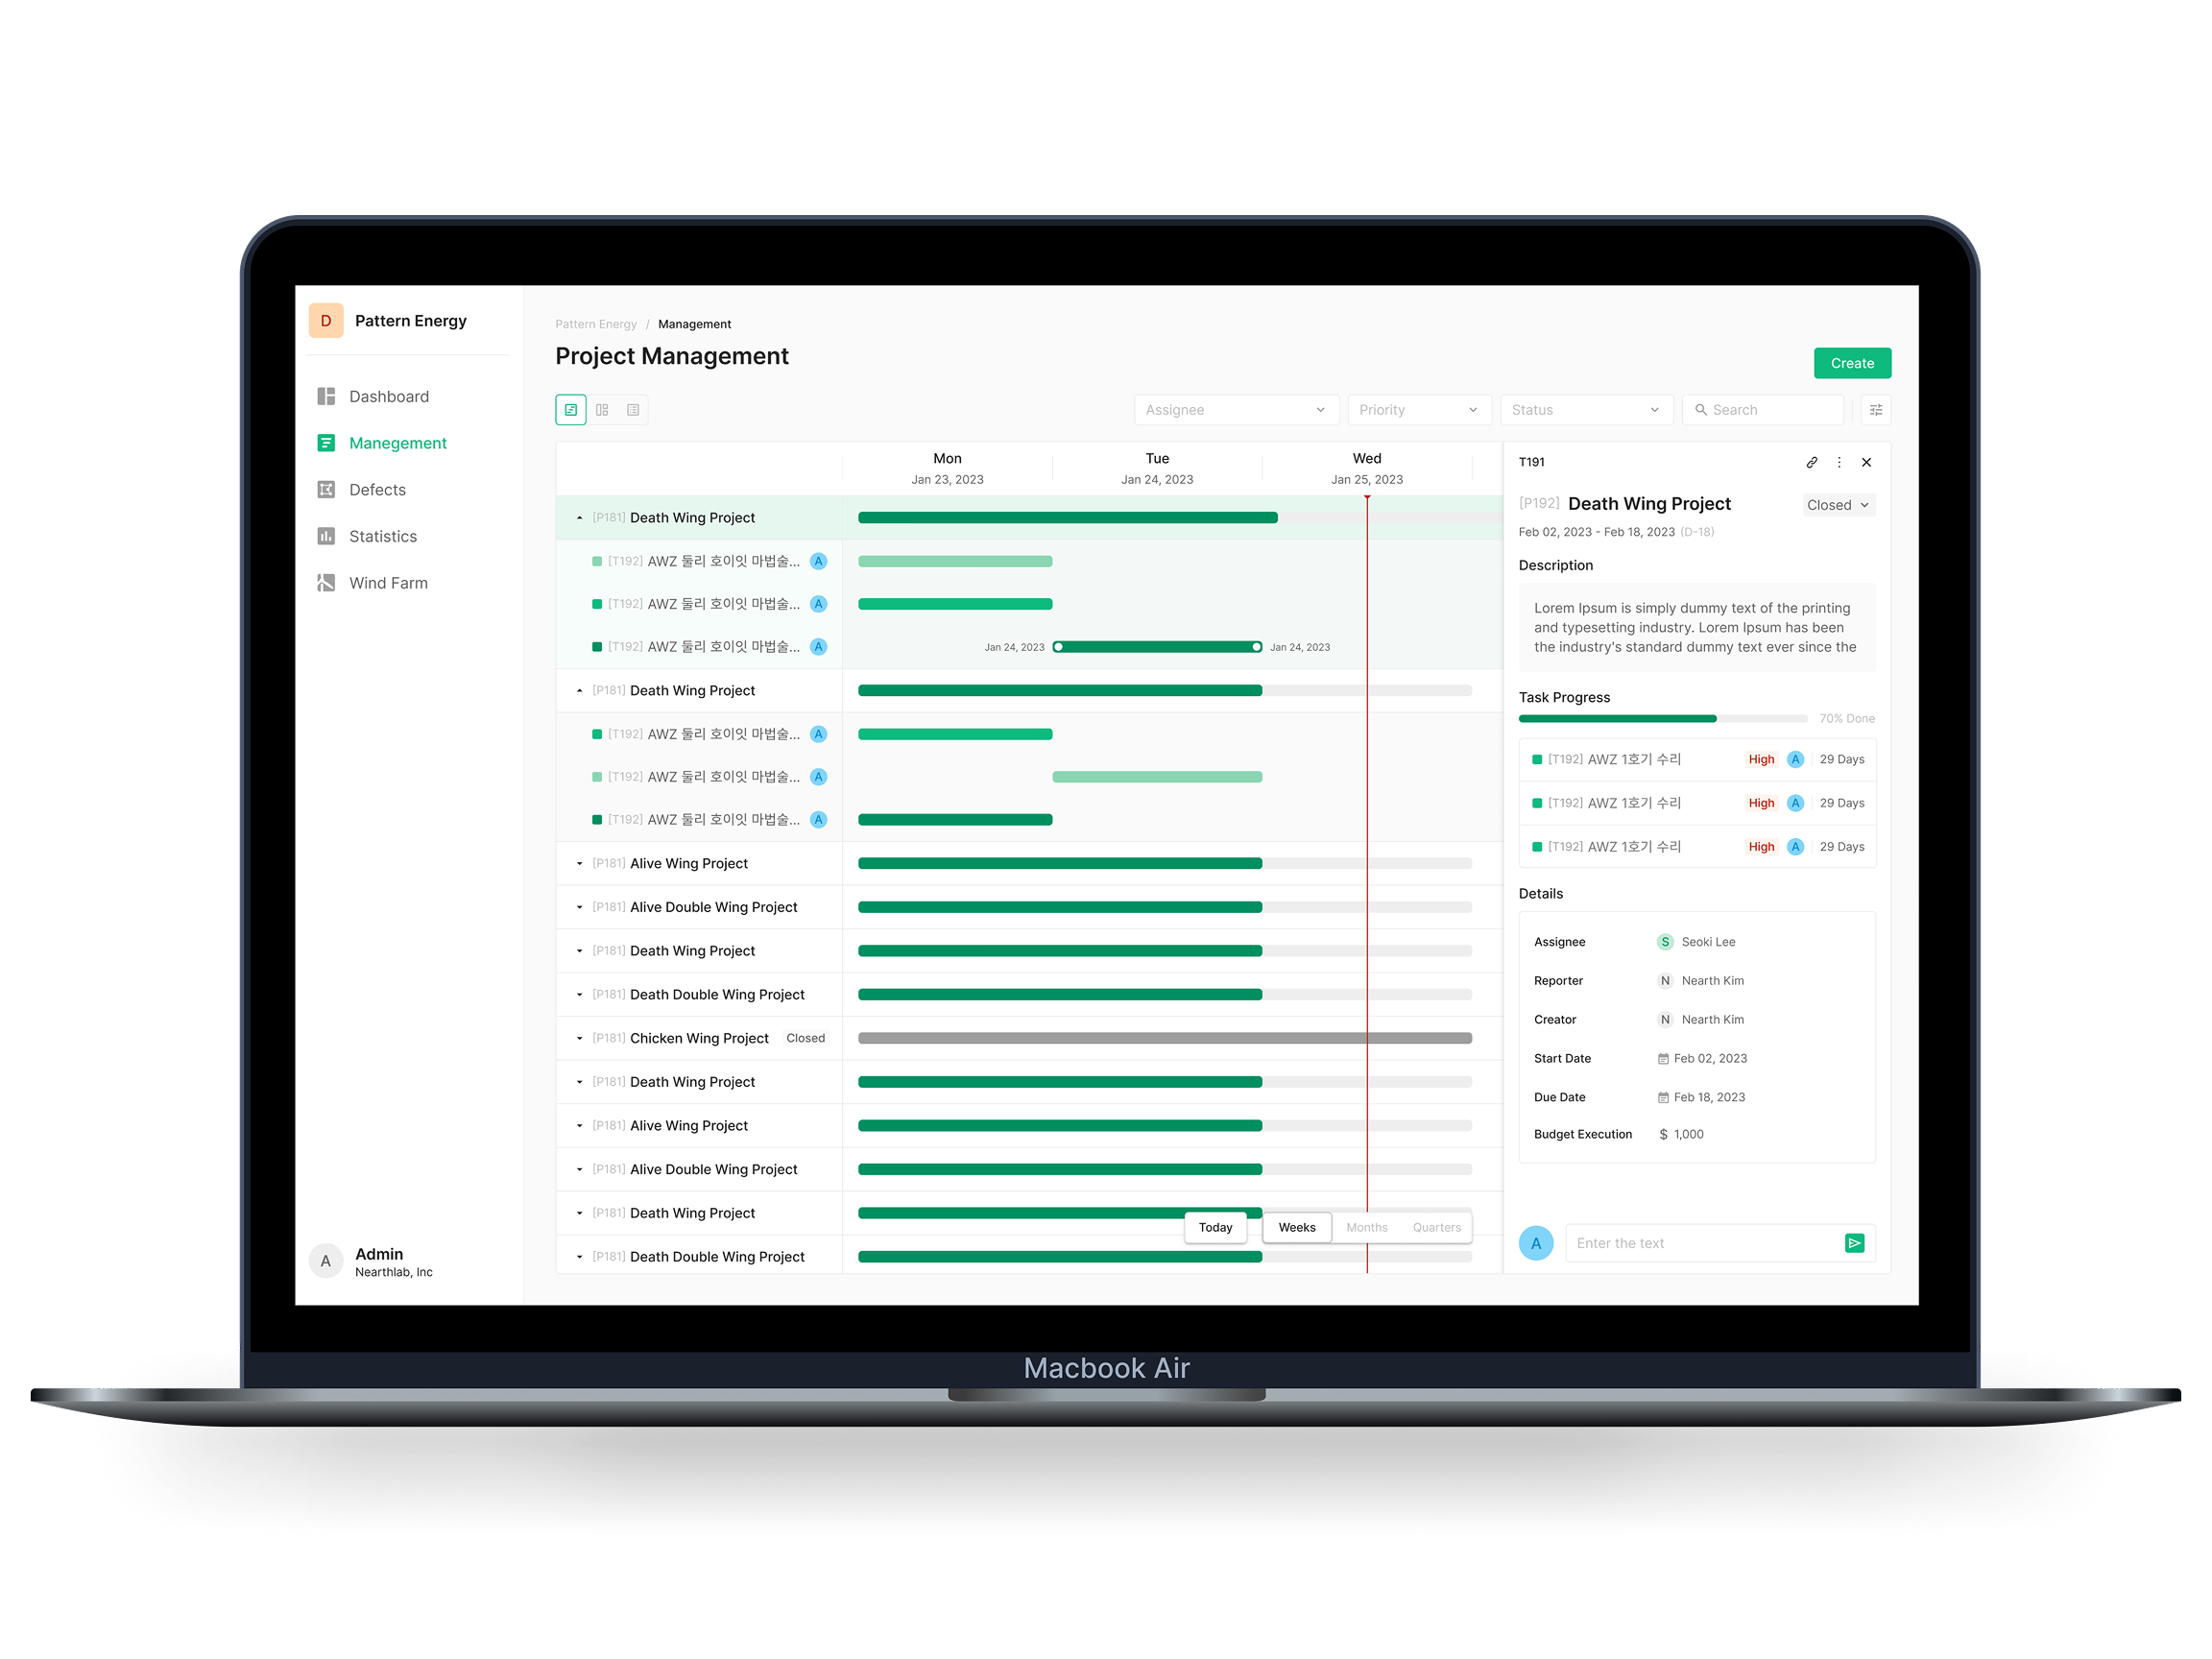
Project & Task management
Create projects with multiple tasks, manage them as Open/Closed. Three task types — Review, Create Report, Repair — and four states — To Do, Working, In Review, Done — track the full repair process.
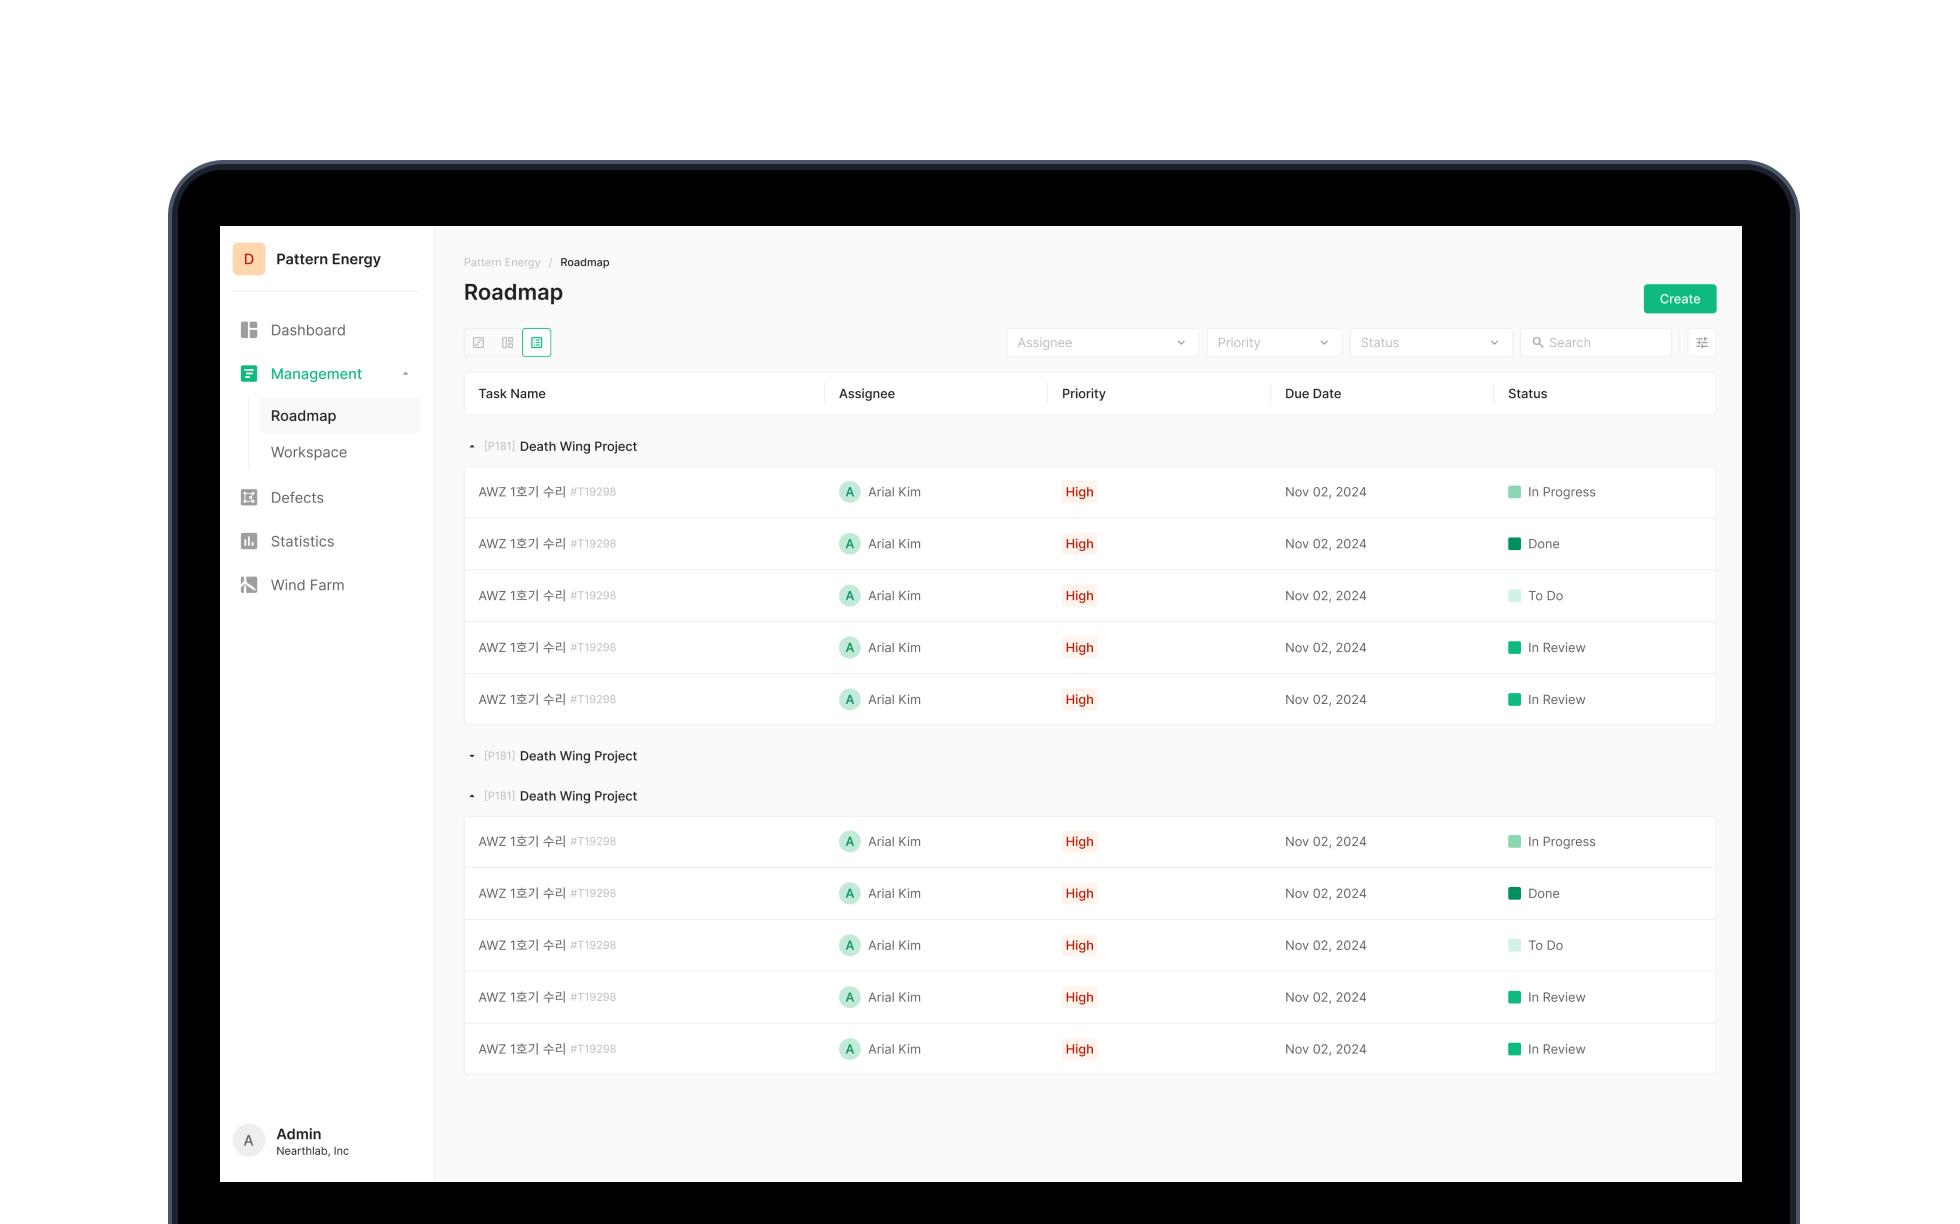
- Kanban board: visually manage current task state
- Gantt chart: lay out projects and tasks against time
- List view: scan tasks fast in list form
- Assignment: assign owners to projects and tasks
- Progress: read project and task progress in real time
Design Decisions
The judgment calls that shaped the product
Why are Blades / Defects / History separate?
All three handle defect data, but they have different jobs. Blades is optimized for position-based exploration. Defects is optimized for issue-centric management. History is optimized for time-series comparison. Stuffing them onto one surface inflates cognitive load and makes it impossible to design role-fit filtering and sorting.
Why are Statistics and Reports split?
Statistics is the analysis tool — explore data and surface patterns. Reports is the output — deliver analysis to customers or teams. Separating analysis from delivery keeps each workflow focused on its own job.
Why does defect review live alongside workflow management?
The weakest link in the field was the information handoff from defect discovery to repair planning. The Management module closes that loop on one platform — from inspection data review through repair assignment — so information doesn't drop or stall.
Outcome & Reflection
Project results
Deployed across global wind farms, managing inspection data for hundreds of turbines — established as the core operational platform.
From Blades through Management — six modules covering the full inspection process as one integrated system.
Two years of field-feedback and customer-driven iteration. Stable operation throughout.
In use at over 12 wind farms globally — the inspection solution that scaled to a global footprint.
Reflection
Zoomable Wind was a project where understanding the customer's real operations deeply led to a product pivot. We started as a tool for viewing drone-captured photos; customer feedback pushed us to redefine the core value as a defect-centric analytics platform. The Defects tab is the most direct example — a meaningful pivot from photo browsing to issue management, born from listening.
Across two years of operation, we kept absorbing user feedback and grew the product from a data viewer into an integrated operational platform spanning inspection, analytics, reporting, history, and repair. What stuck with me: the experience of letting customer voice set product direction, and the practice of designing around operational value instead of feature surface.