UX/UI Design · 2022–2024
Zoomable Worker
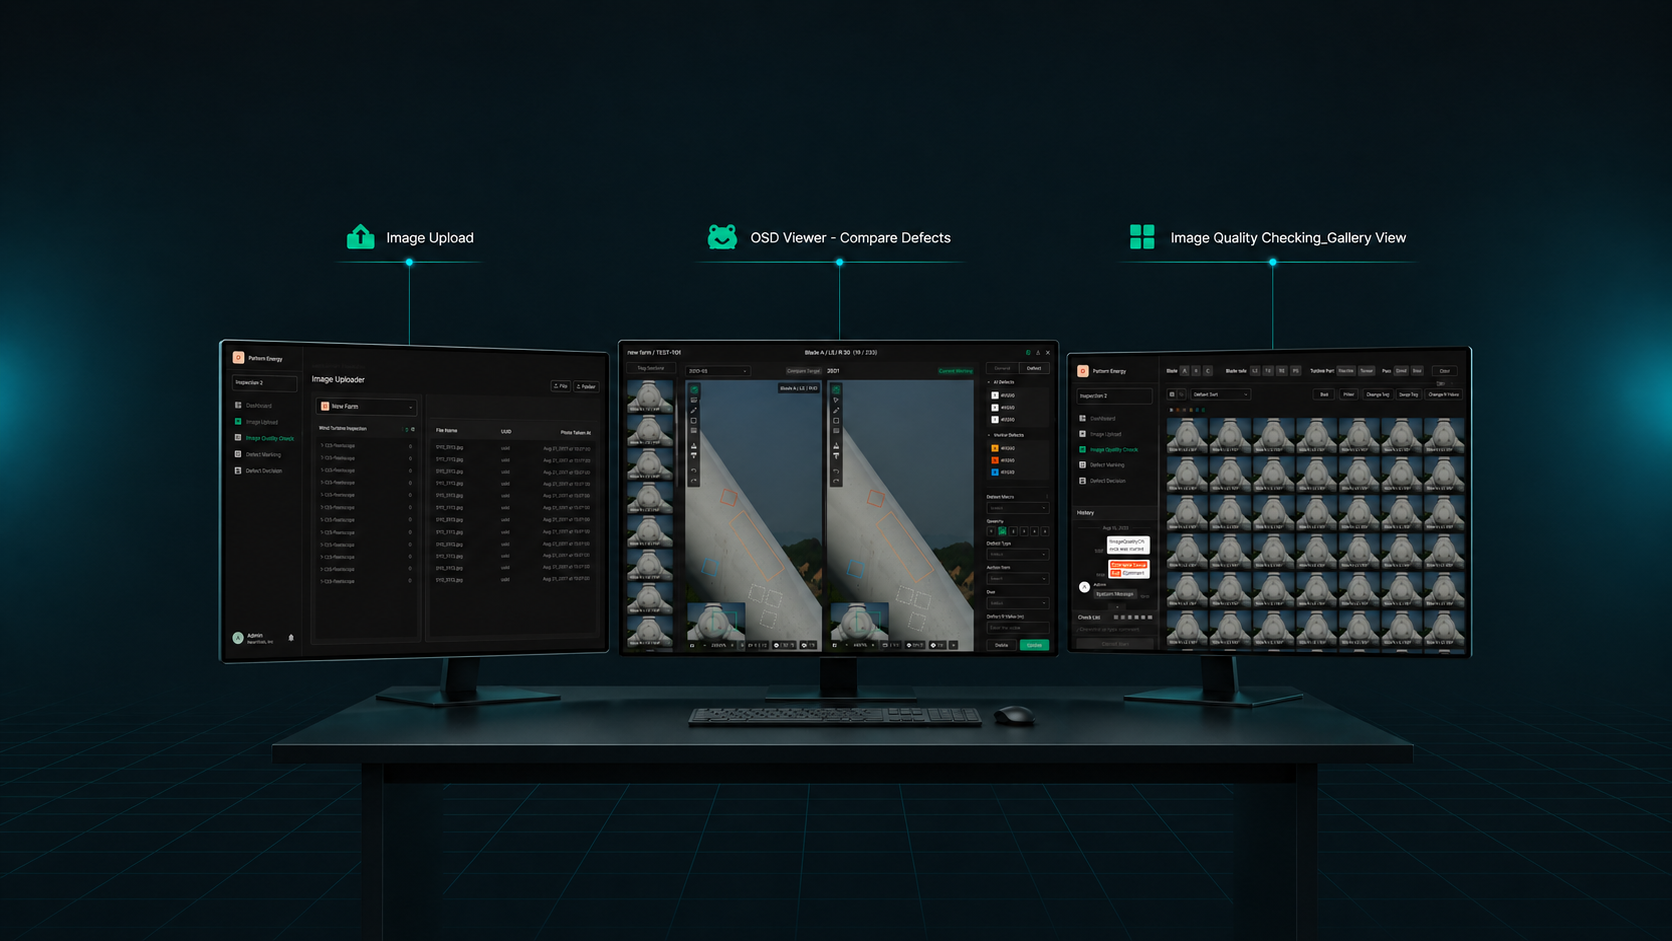
An AI- and drone-driven workflow platform for wind turbine blade inspection. Image collection, quality check, defect marking, final decision, operational dashboard, flight log — the entire field inspection operation runs as one system.
Key insights surfaced in the research
Fragmented inspection workflow
Image upload, quality check, defect marking, and final decision lived in different tools or manual steps. Data dropped between stages and work piled up at the seams.
No image quality management
Hundreds of drone-captured images, low-quality ones included, pushed straight into analysis. Detection accuracy dropped, and re-shoot costs kept recurring.
Communication broken across roles
Pilots, inspectors, and managers worked in different systems. Status didn't propagate, flight log and inspection record didn't connect, and the operation ran on thin visibility.
From these findings, Zoomable Worker was scoped not as another AI defect detector but as a workflow platform that connects the entire inspection operation as one piece.
Overview
From image capture to operational management,
the inspection pipeline as one platform
Zoomable Worker is the workflow platform that combines AI and drone capture to inspect wind turbine blades and identify defects. Drones collect high-resolution images, AI runs first-pass detection, humans verify, and final decisions land — the entire process inside one system.
It's built around seven core modules — Upload, Quality Check, OSD Viewer, Defect Marking, Decision, Dashboard & Notifications, Flight Log — designed so pilots, inspectors, and managers collaborate inside one surface.
Product Structure
End-to-end inspection workflow
Zoomable Worker structures the inspection process into seven function modules. Each runs independently, but data flows naturally to the next step.
Image Upload
Bulk-upload drone images with auto-linked metadata — the entry point of the inspection data pipeline.
Quality Check
Verify image quality and filter low-quality data — the gate that protects downstream analysis accuracy.
OSD Viewer
Identify defects on ultra-high-resolution imagery and review AI detection results — the inspector's workbench.
Defect Marking
Convert visual findings into structured defect data — classified by type and severity.
Defect Decision
Final review of marked defects and the repair-or-not call — the judgment gate.
Dashboard
Real-time monitoring across farms with notifications that coordinate a distributed team — the operational hub.
Flight Log
Collect and process pilot flight logs to support invoicing and customer reporting — the operational record layer.
Core Feature 01
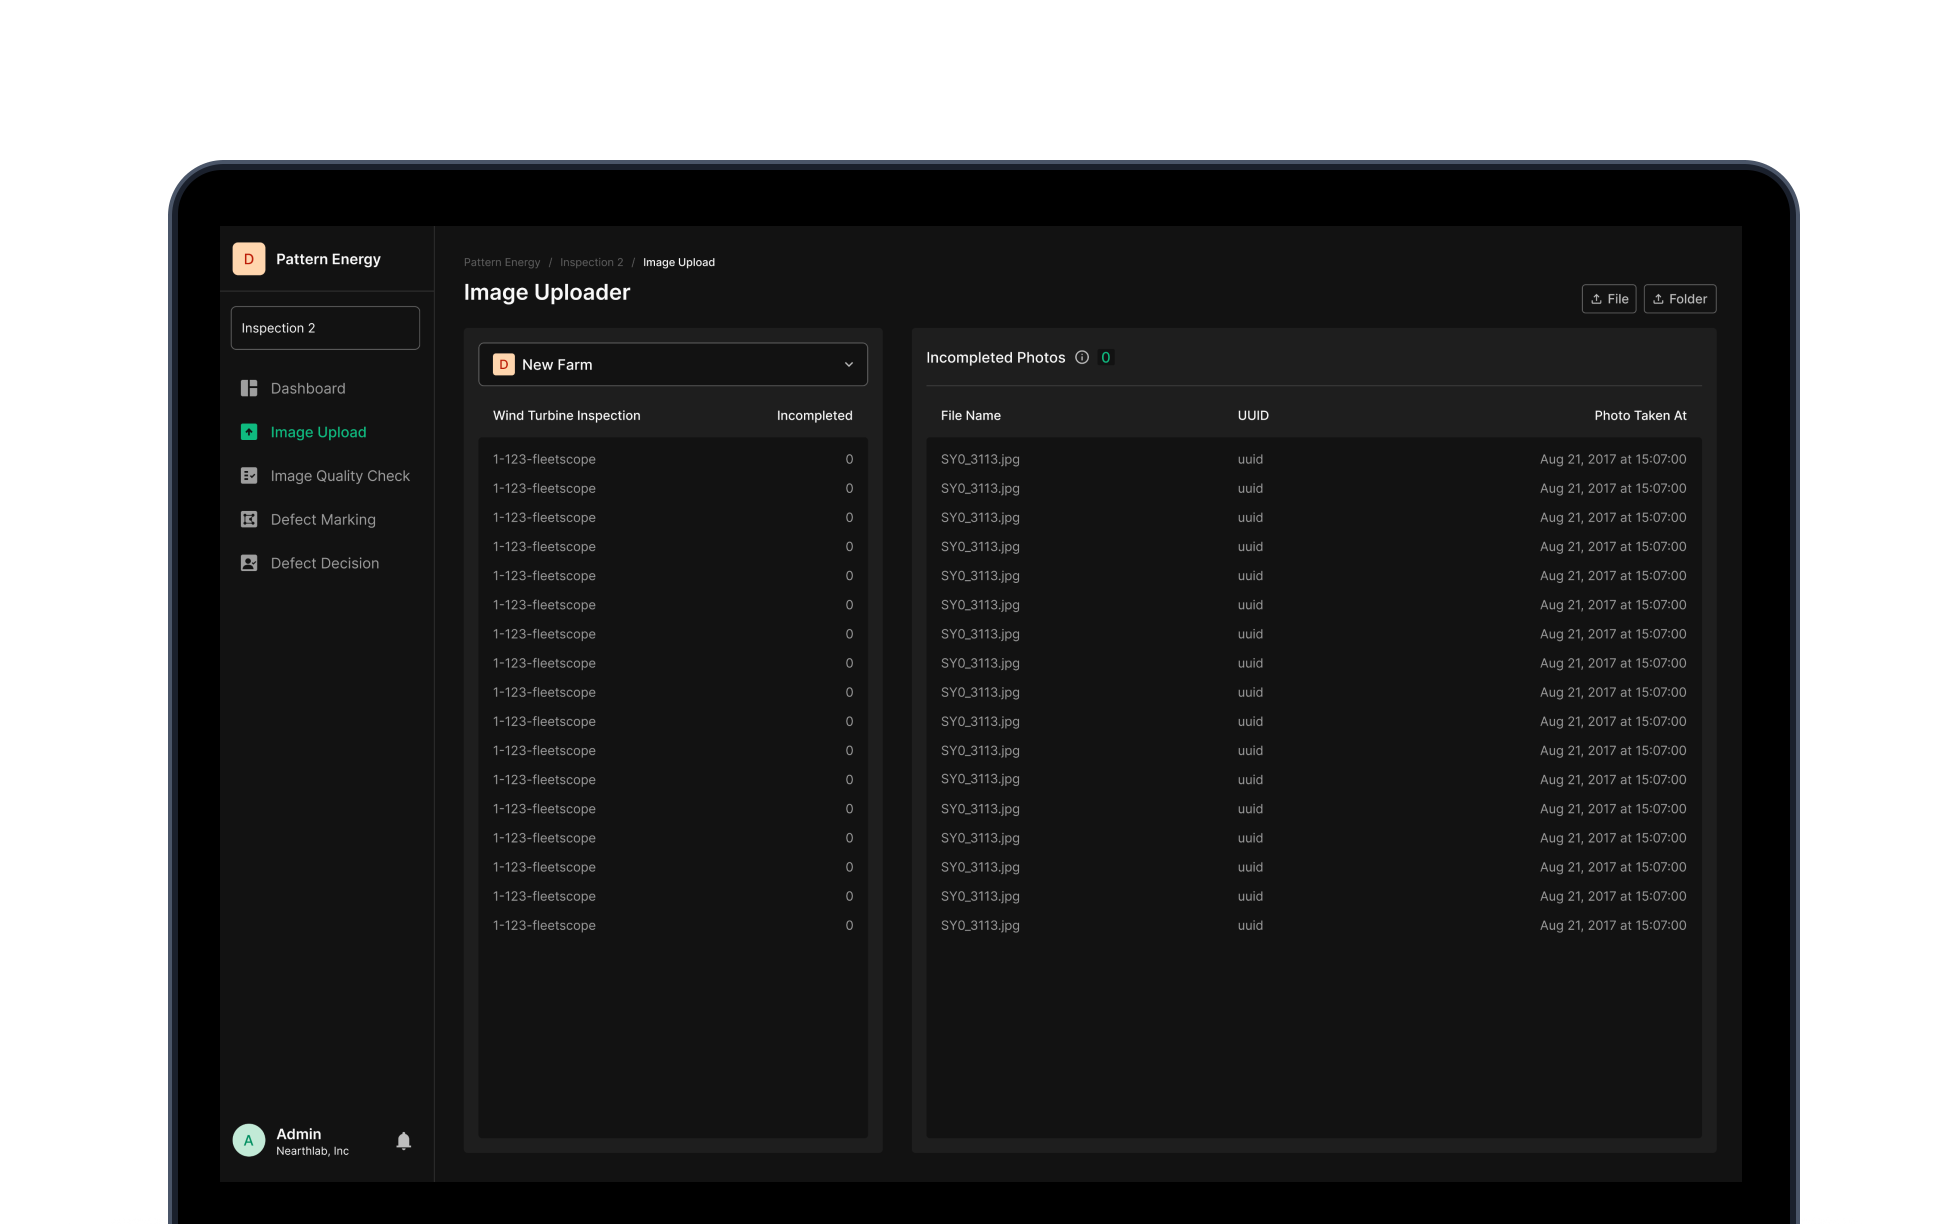
Image Upload
The entry point of the inspection workflow. Bulk-upload hundreds of blade images at once and auto-link metadata — turbine ID, blade position, timestamp. Not a file uploader — the first quality gate that decides how trustworthy downstream analysis can be.
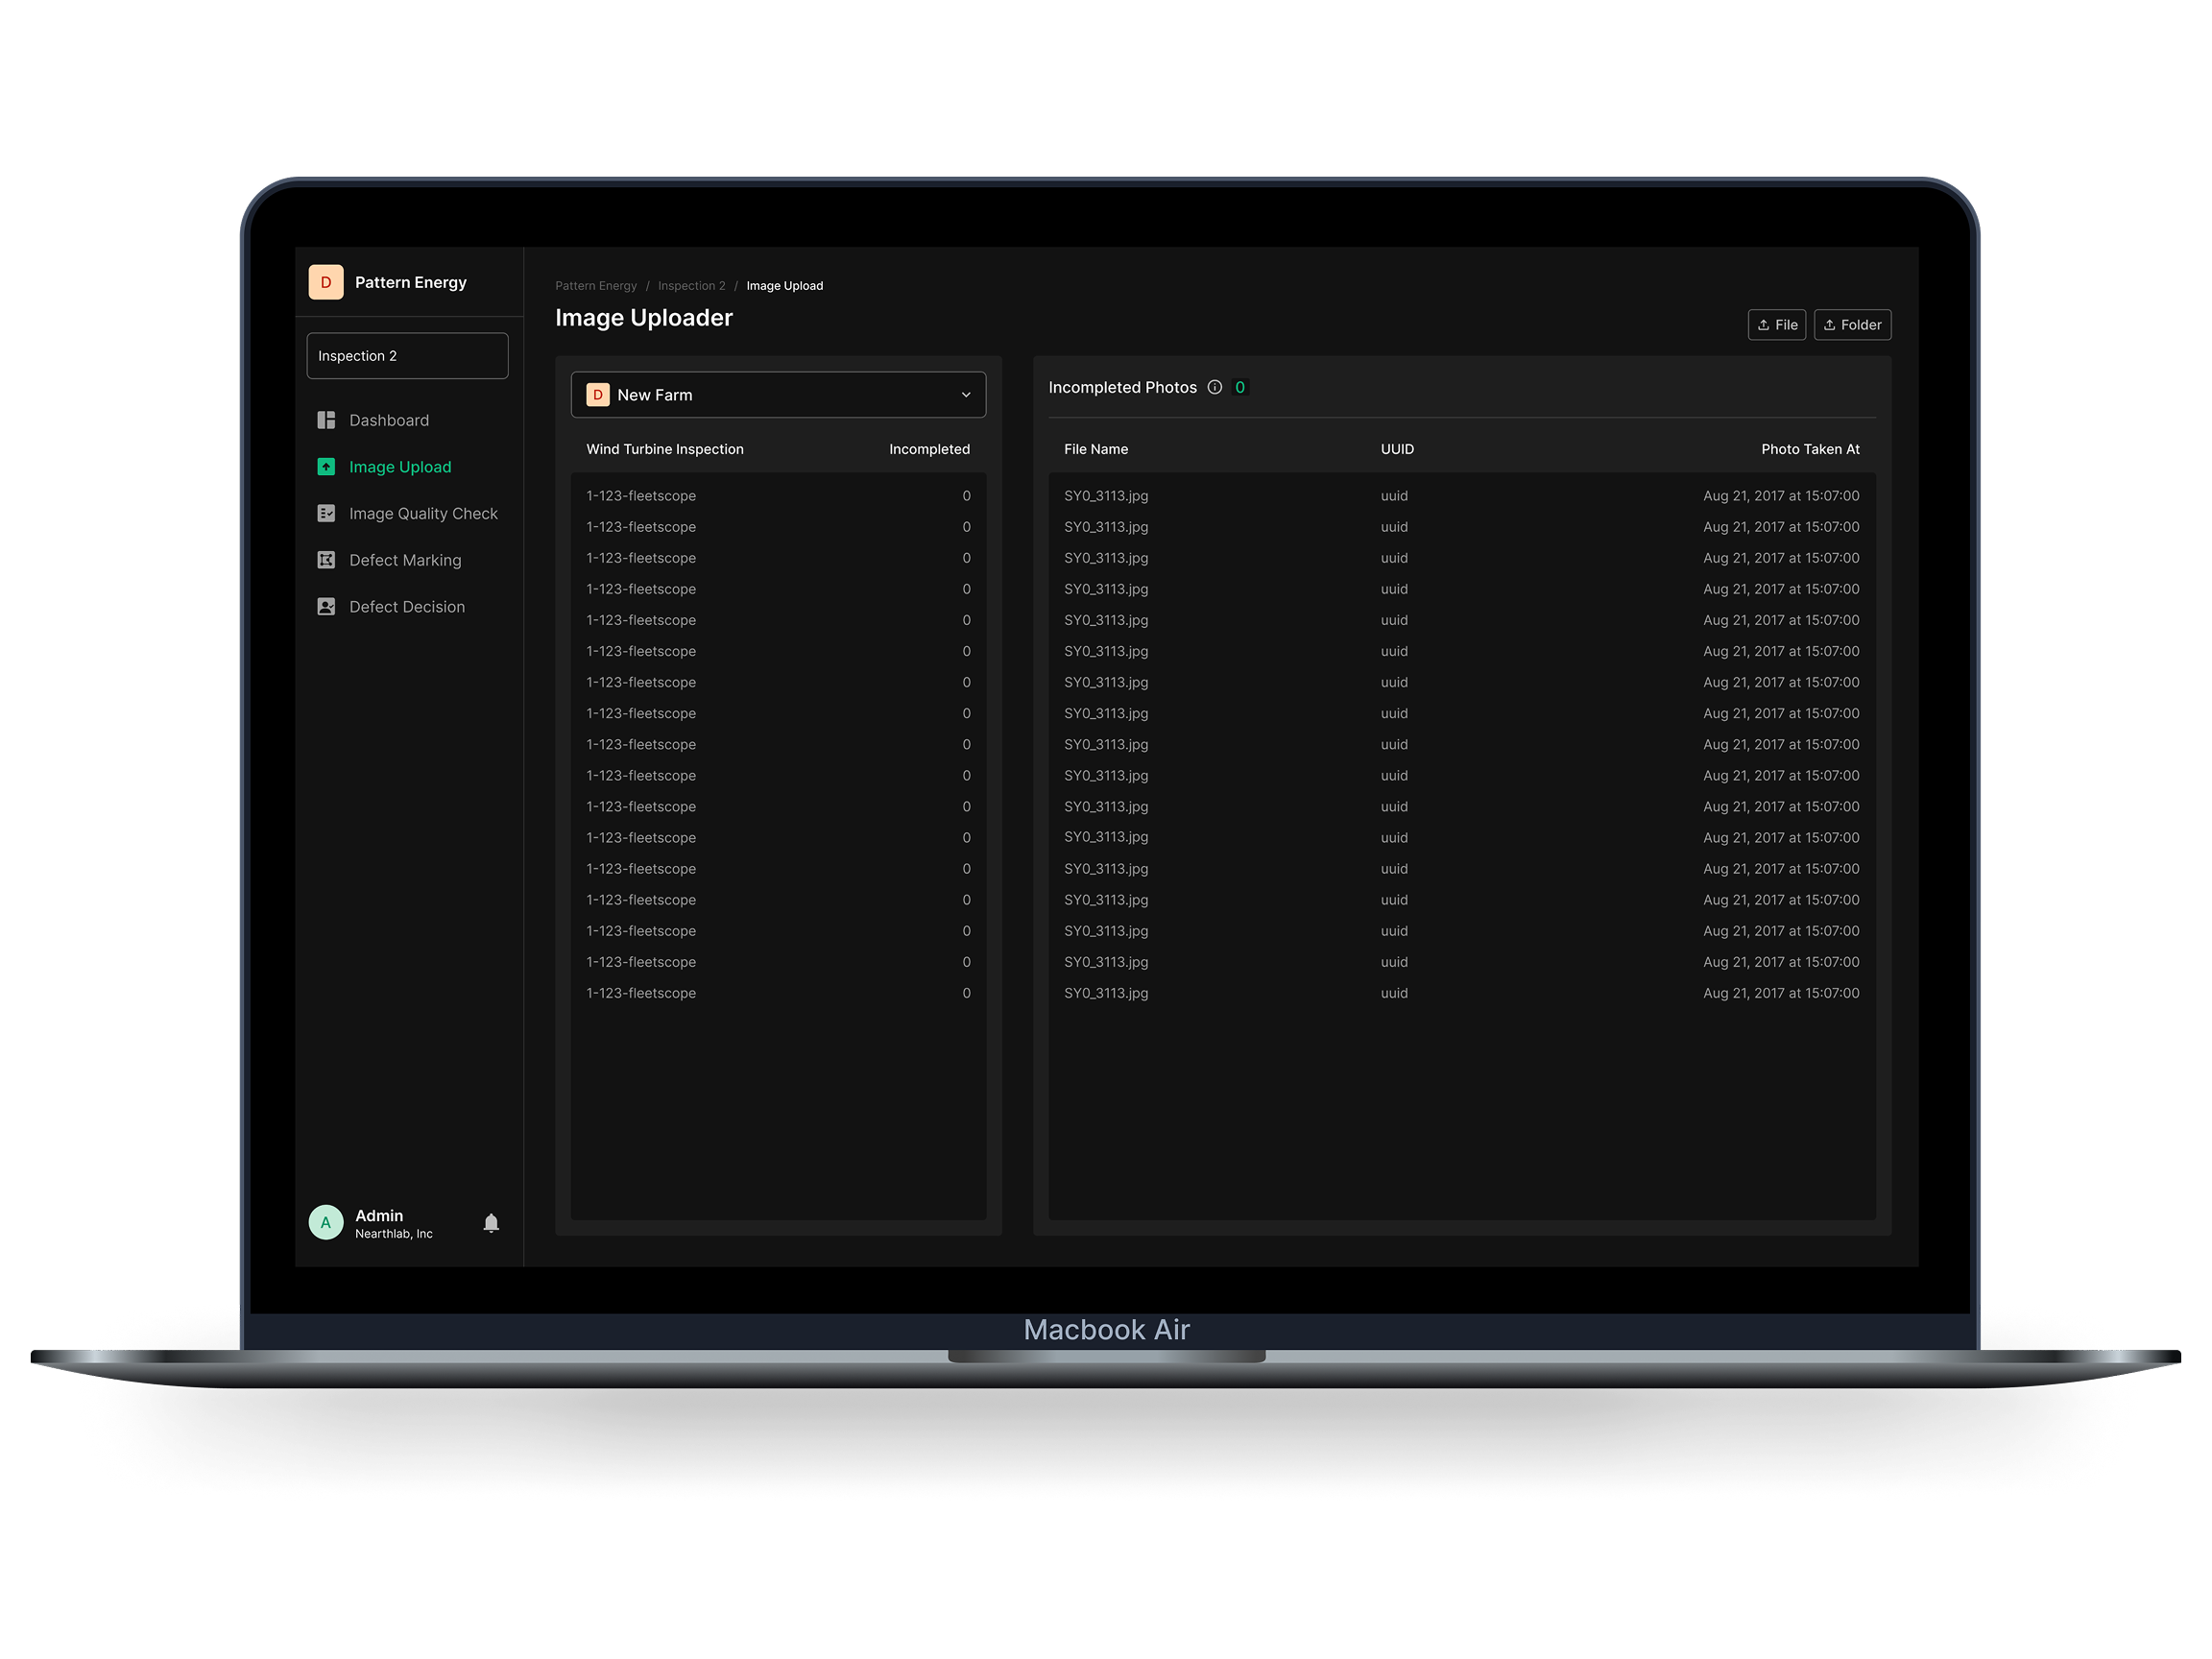
Bulk upload + metadata linking
Upload many images at once with auto-linked turbine ID, blade position, and timestamp. Manual entry drops, data accuracy goes up, downstream errors don't compound.
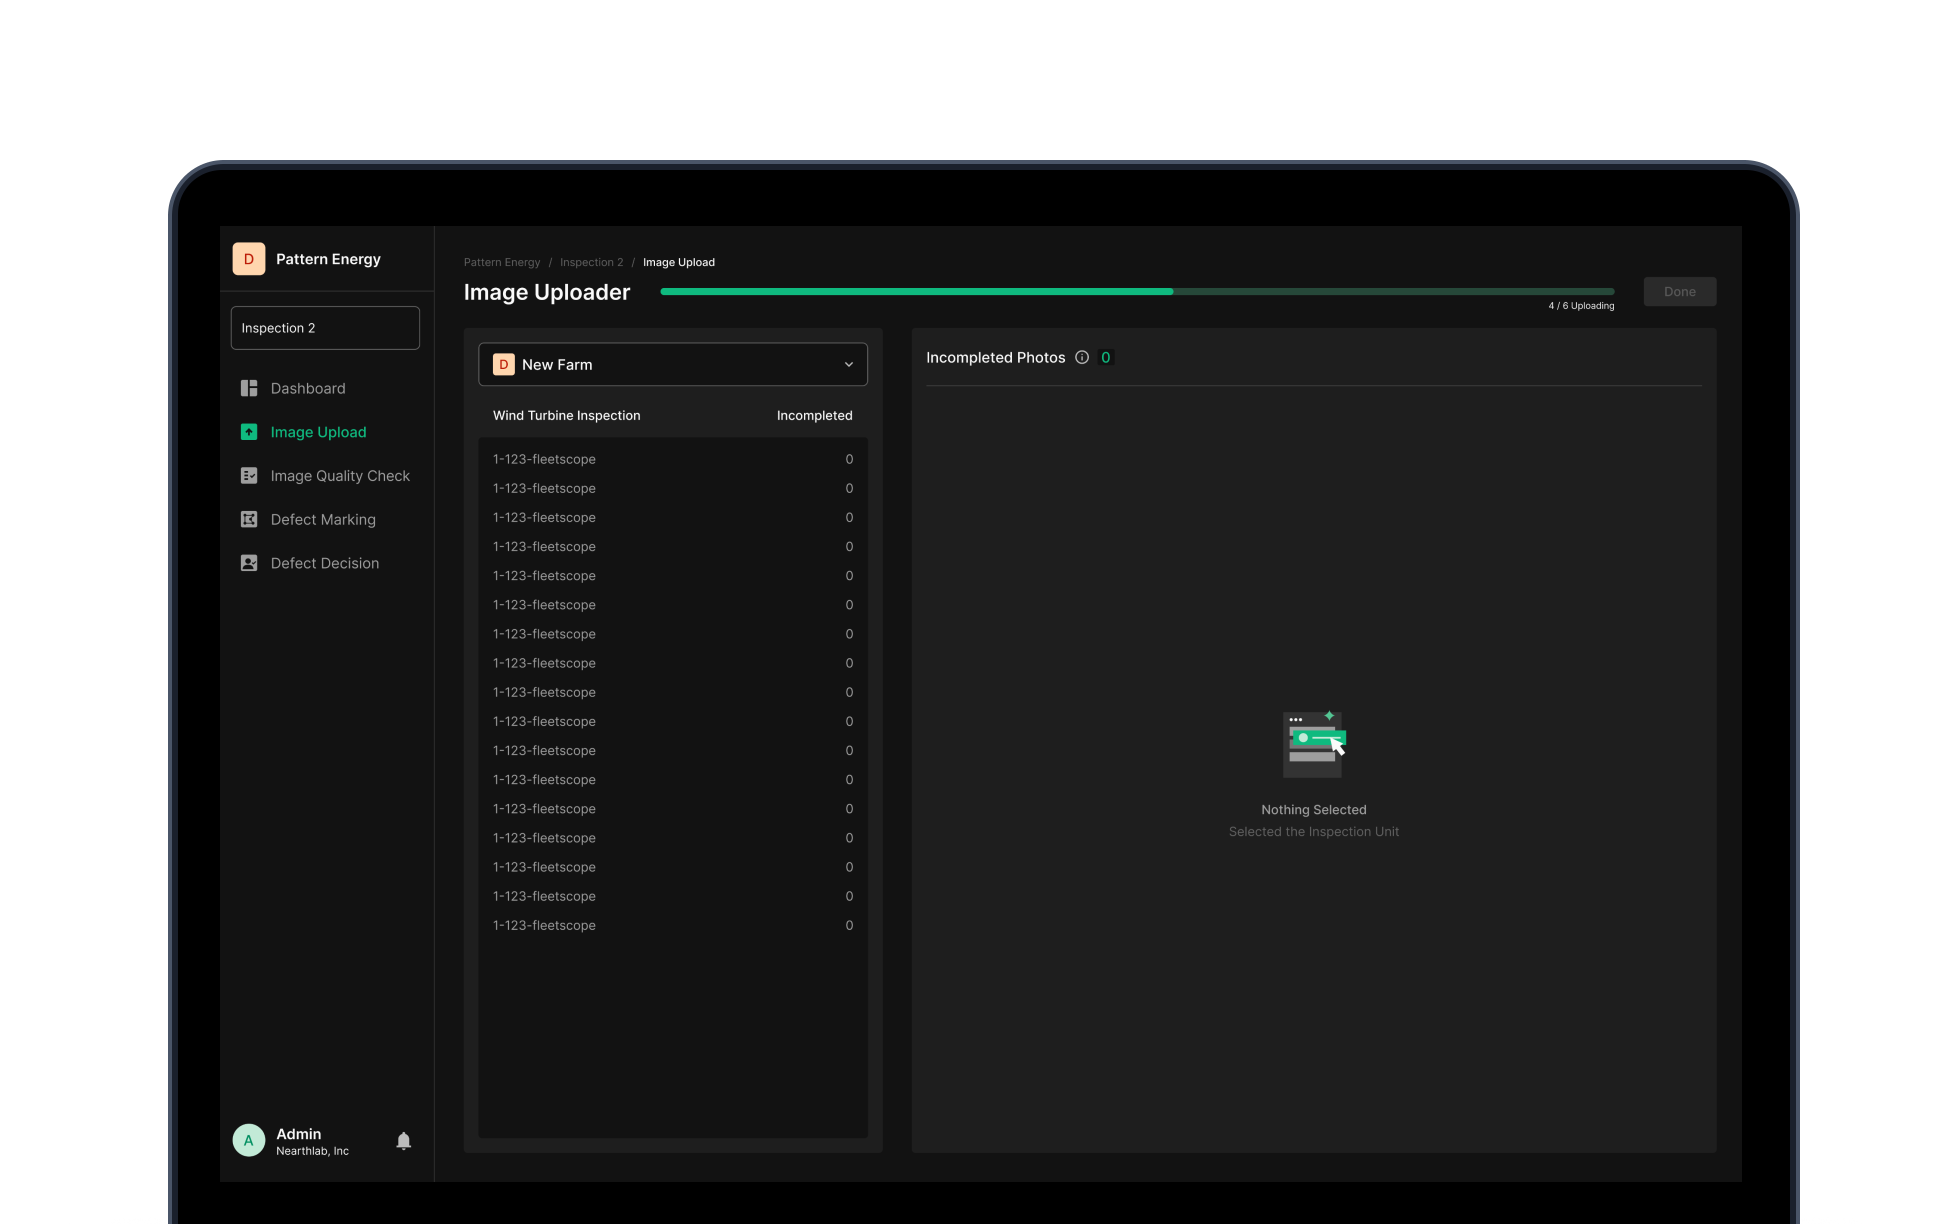
Pre-check + filtering
Initial quality is assessed on upload, and low-quality images get flagged. Quality gets enforced before analysis begins — rework cost falls.
Progress + error handling
Real-time upload progress and completion state. Alerts and logs catch errors as they happen — data integrity and storage security stay intact.
Core Feature 02
Image Quality Check
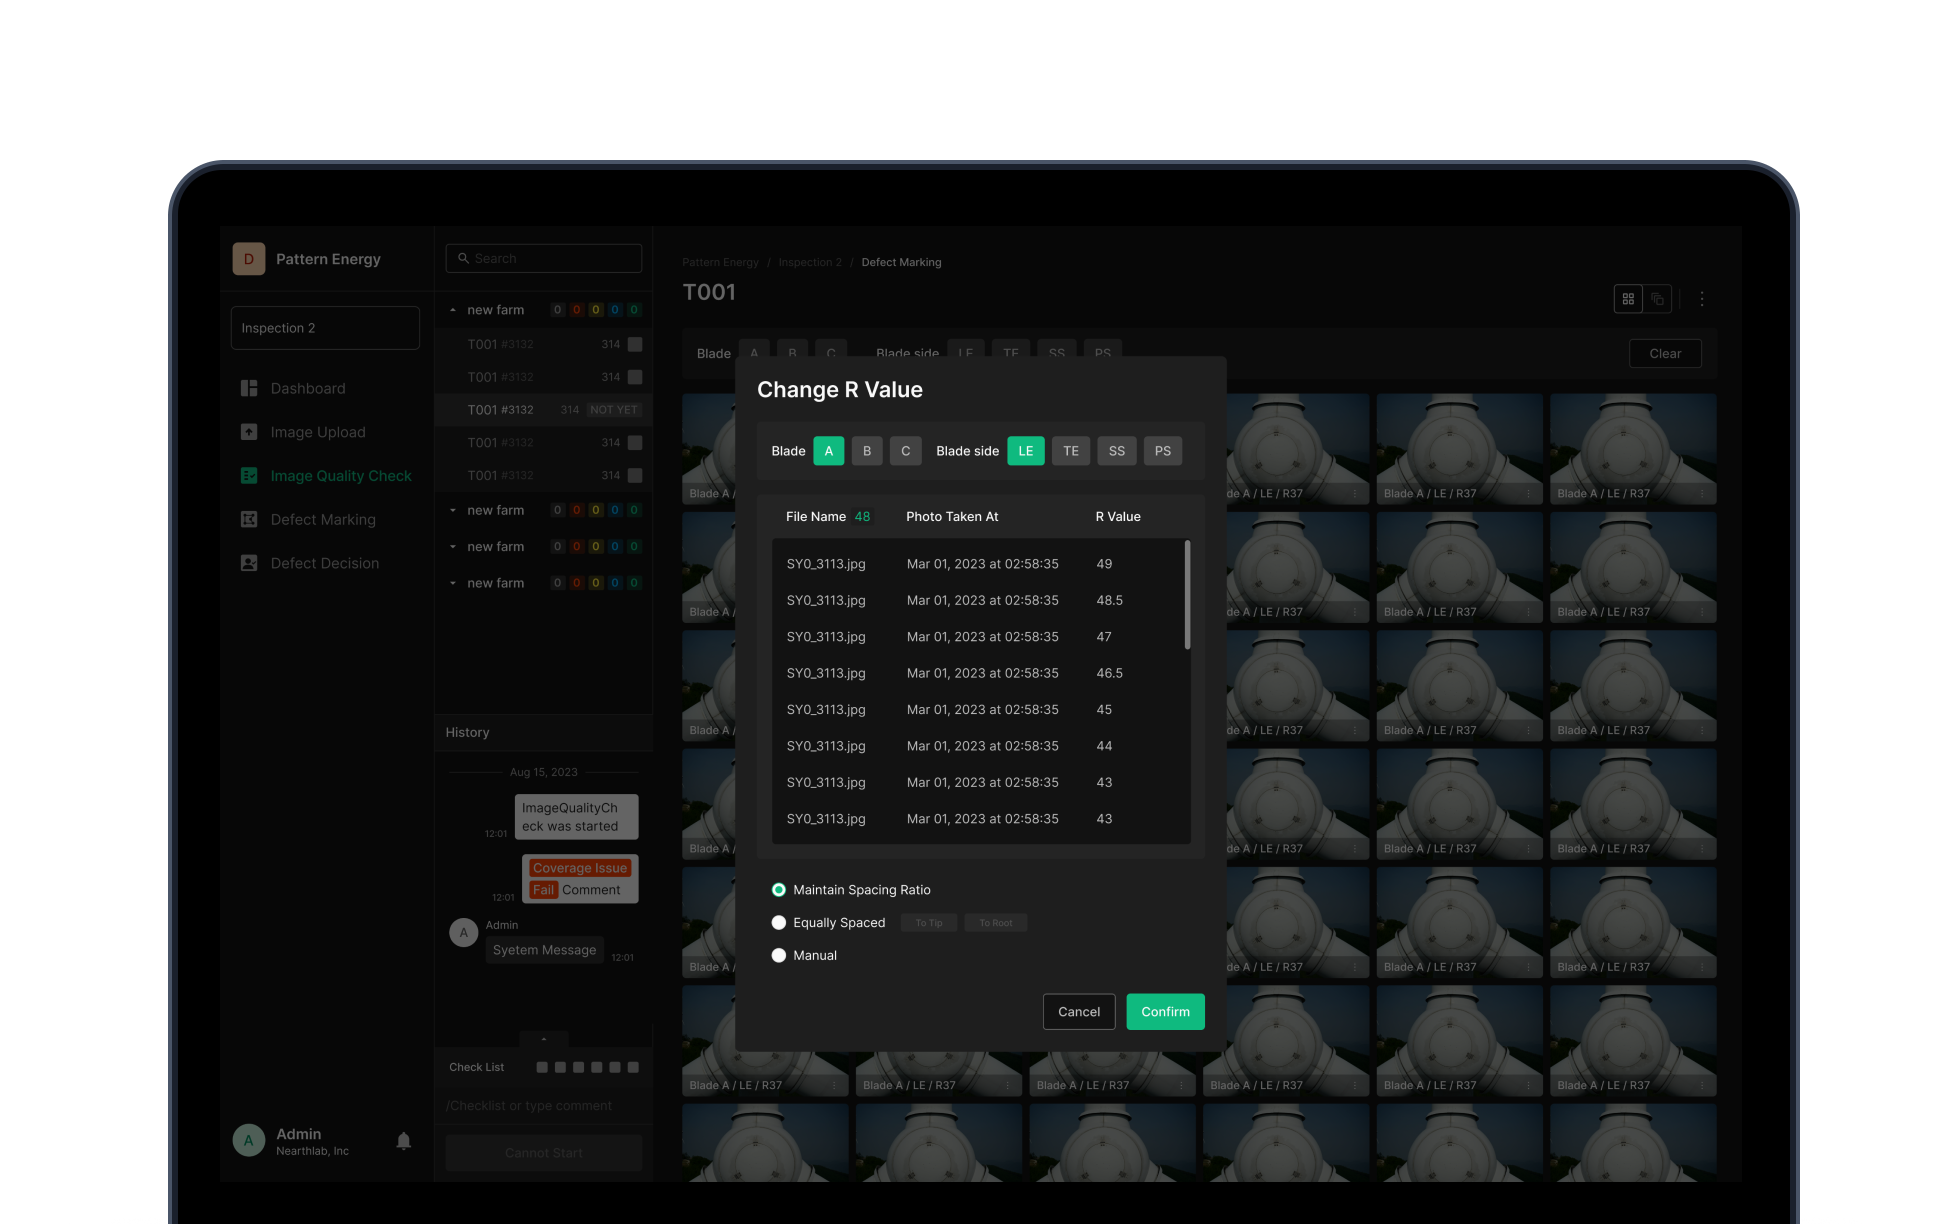
Defect call accuracy lives or dies by the input image. This is the gate that verifies every uploaded image is good enough to read for defects. Grid View and Stitching View catch missing capture coverage, and image attributes — blur, brightness — get evaluated. Below threshold, re-capture gets requested.
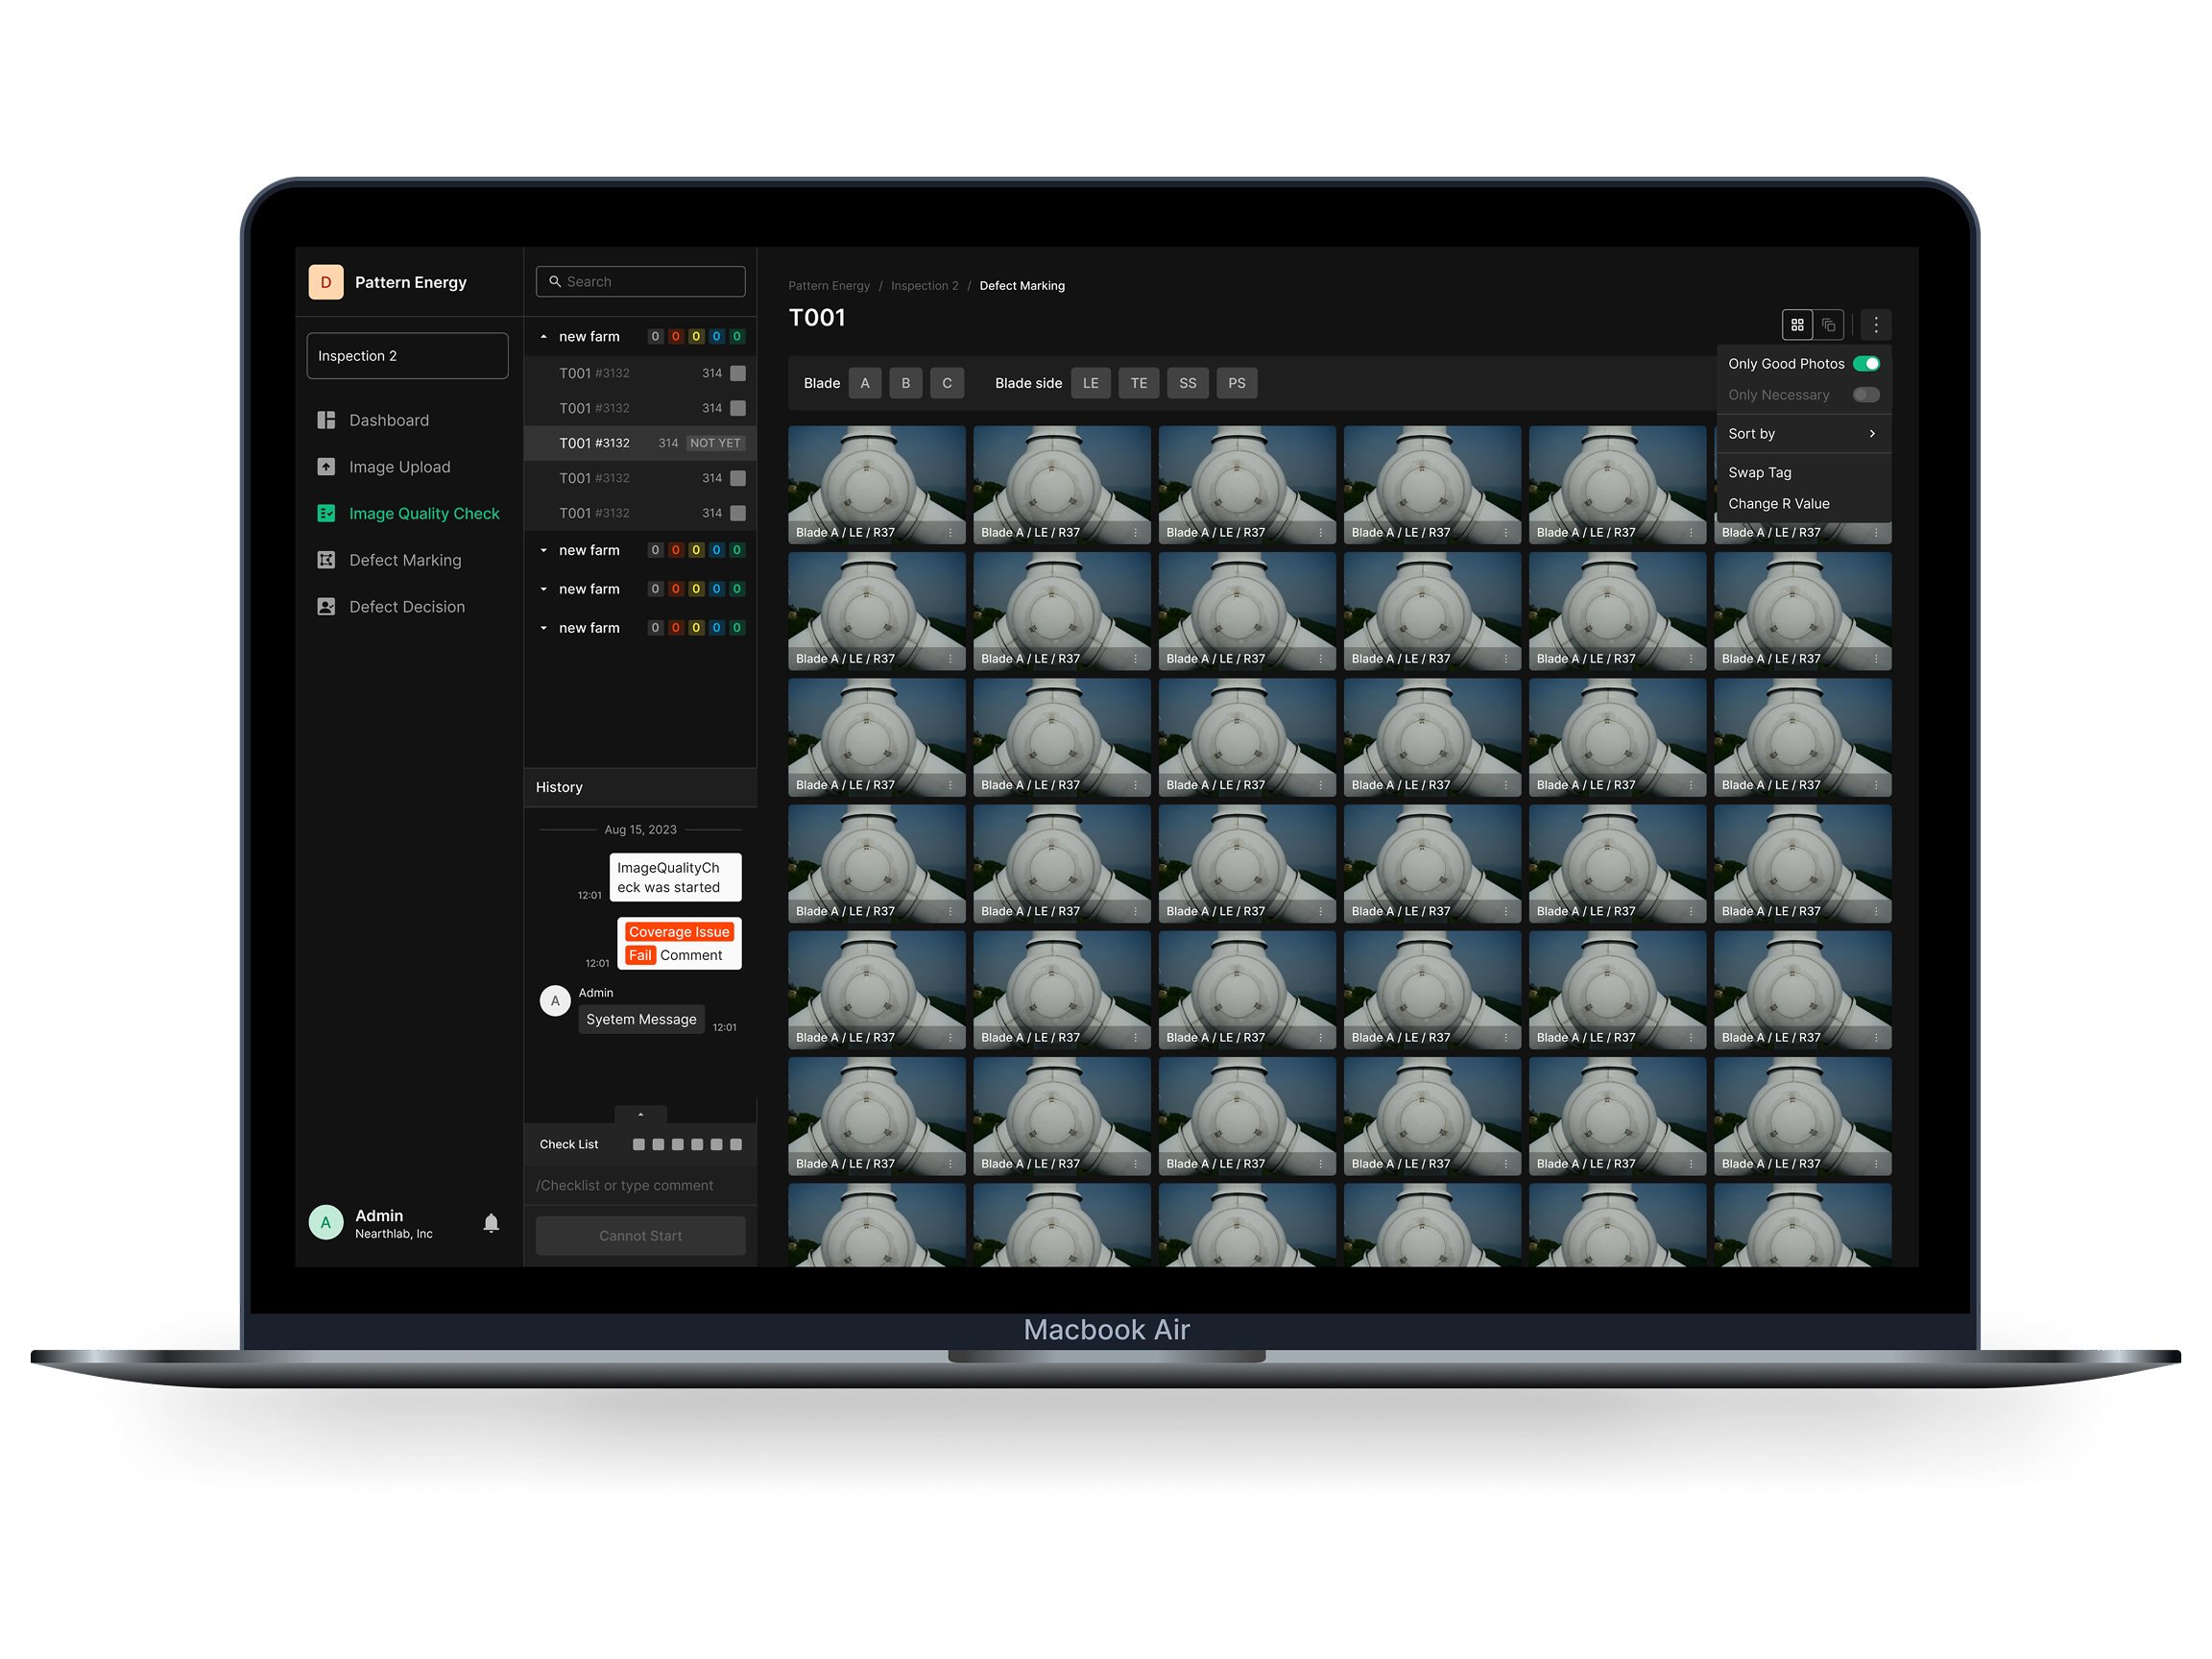
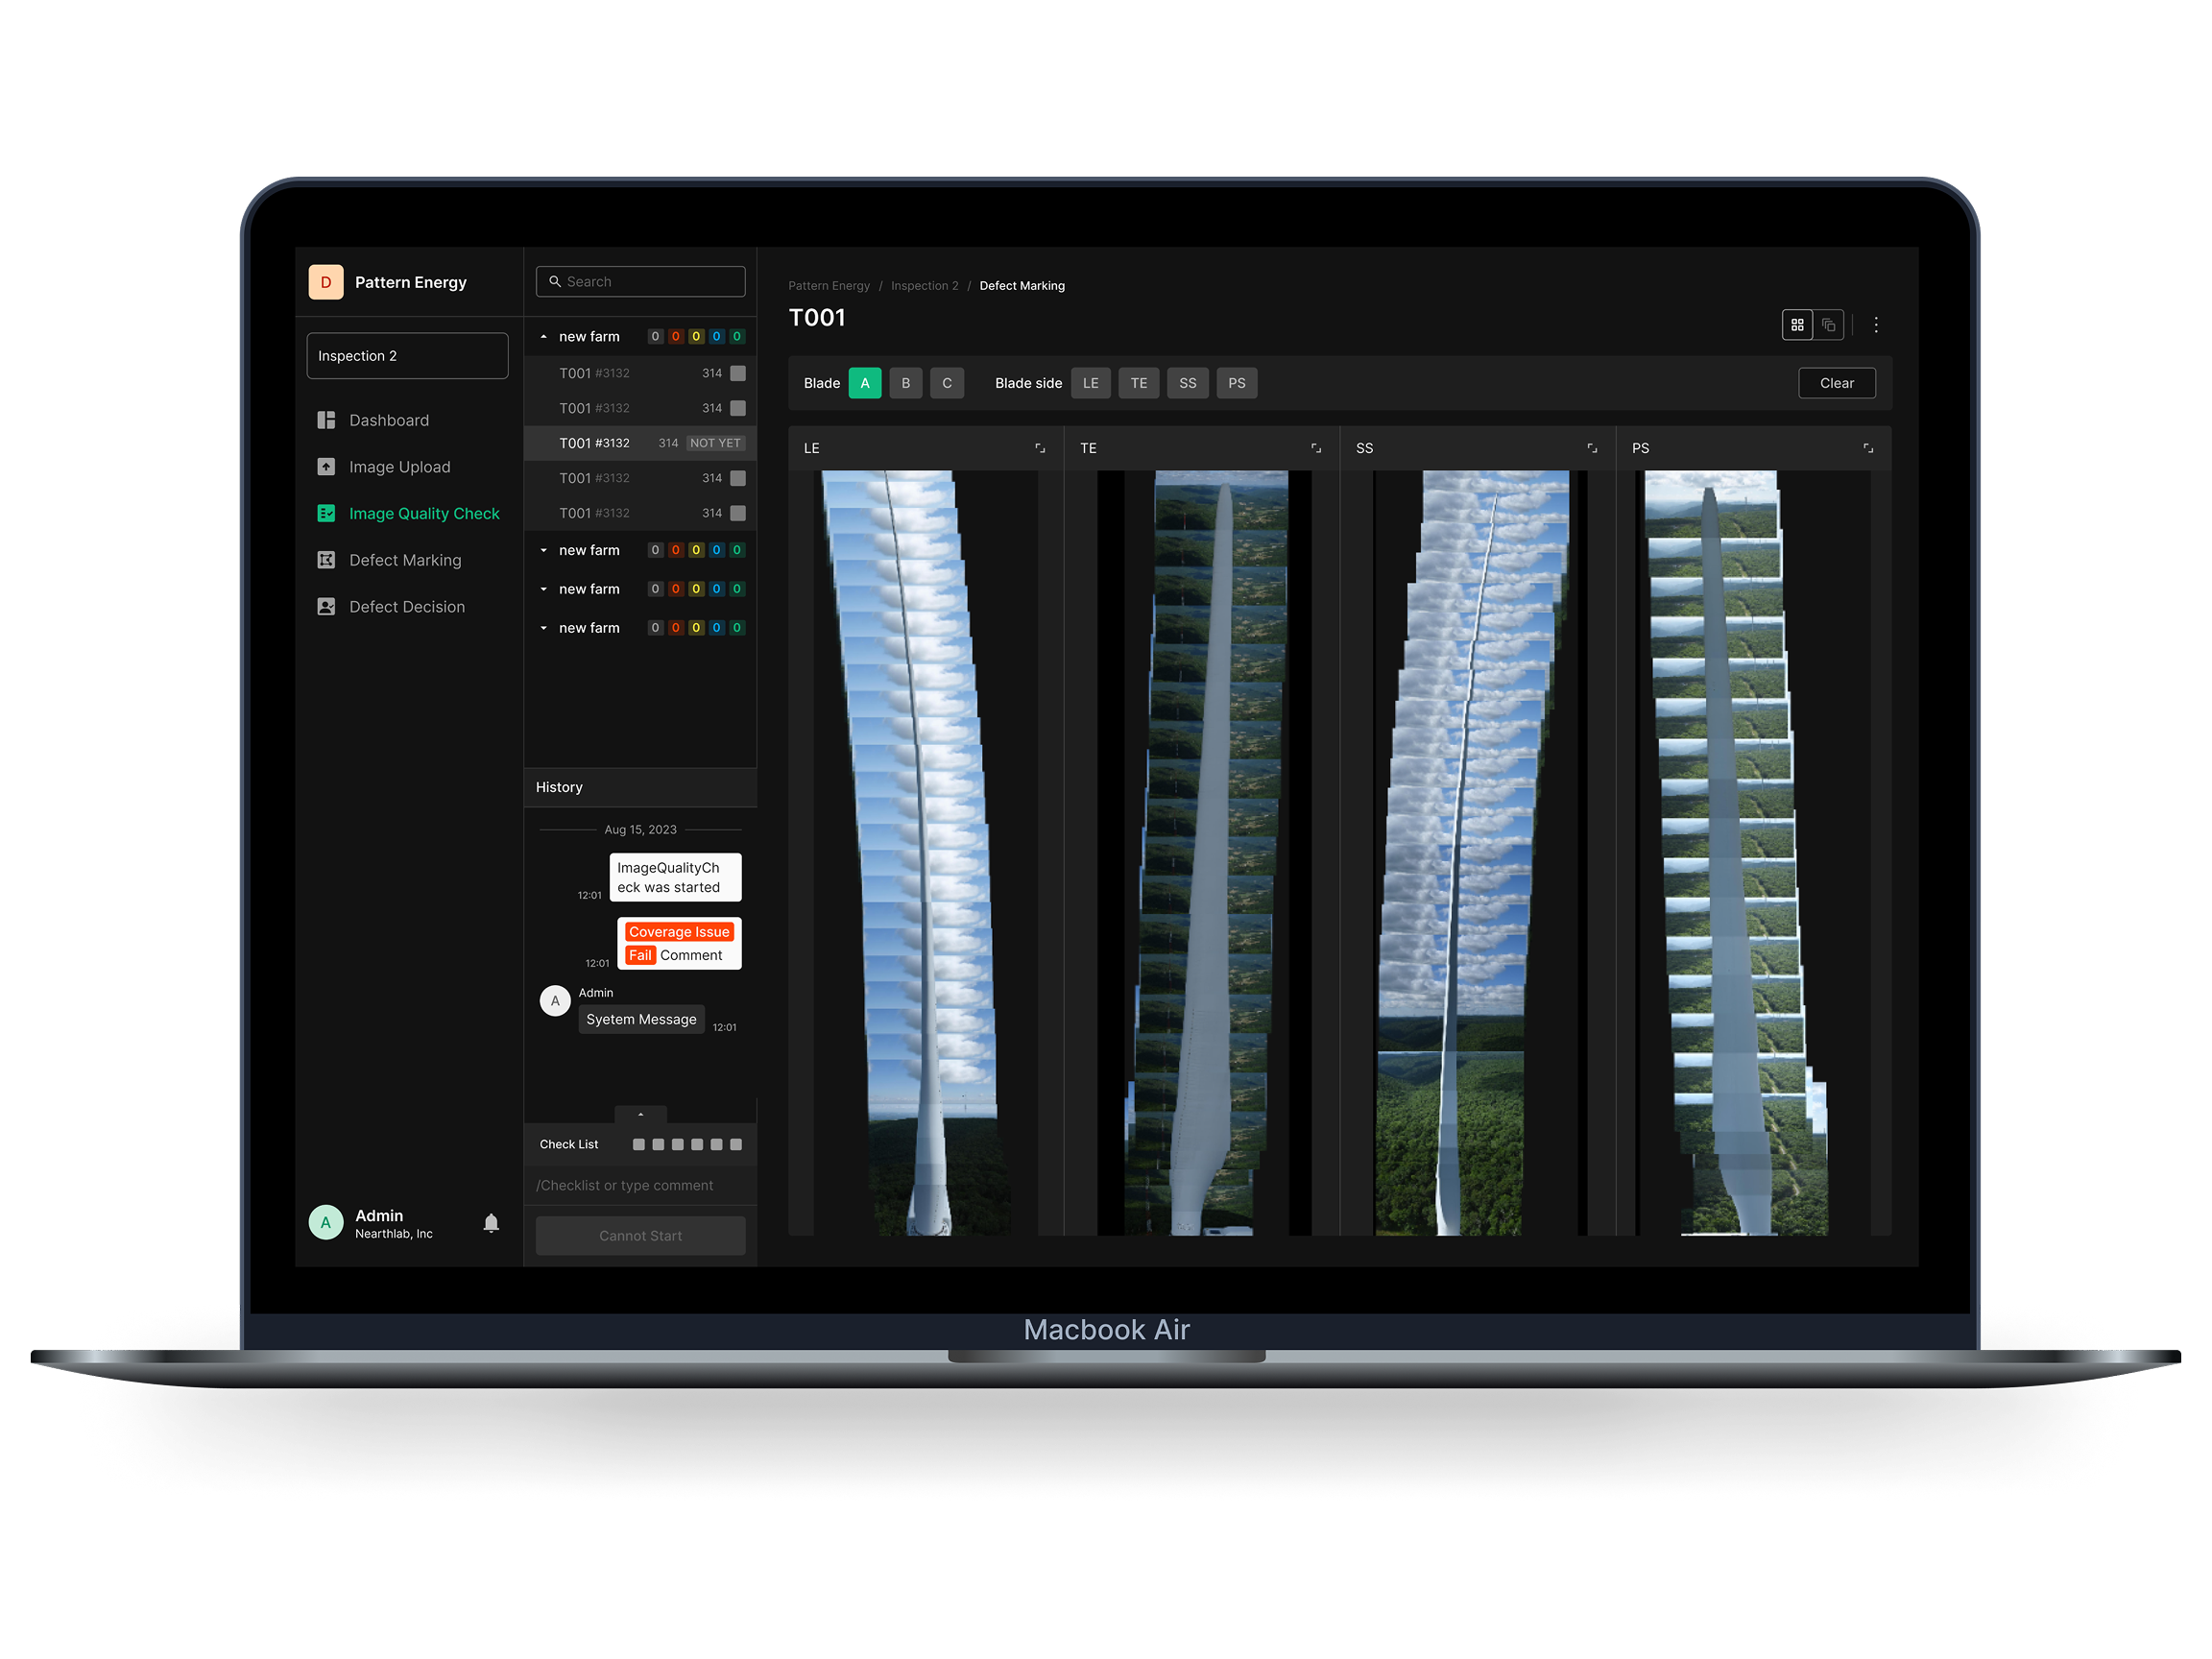
Inspection + classification
Verify uploaded images and classify by quality. Stitching View and Grid View catch missing capture data and confirm full blade coverage.
Adjustment + re-shoot
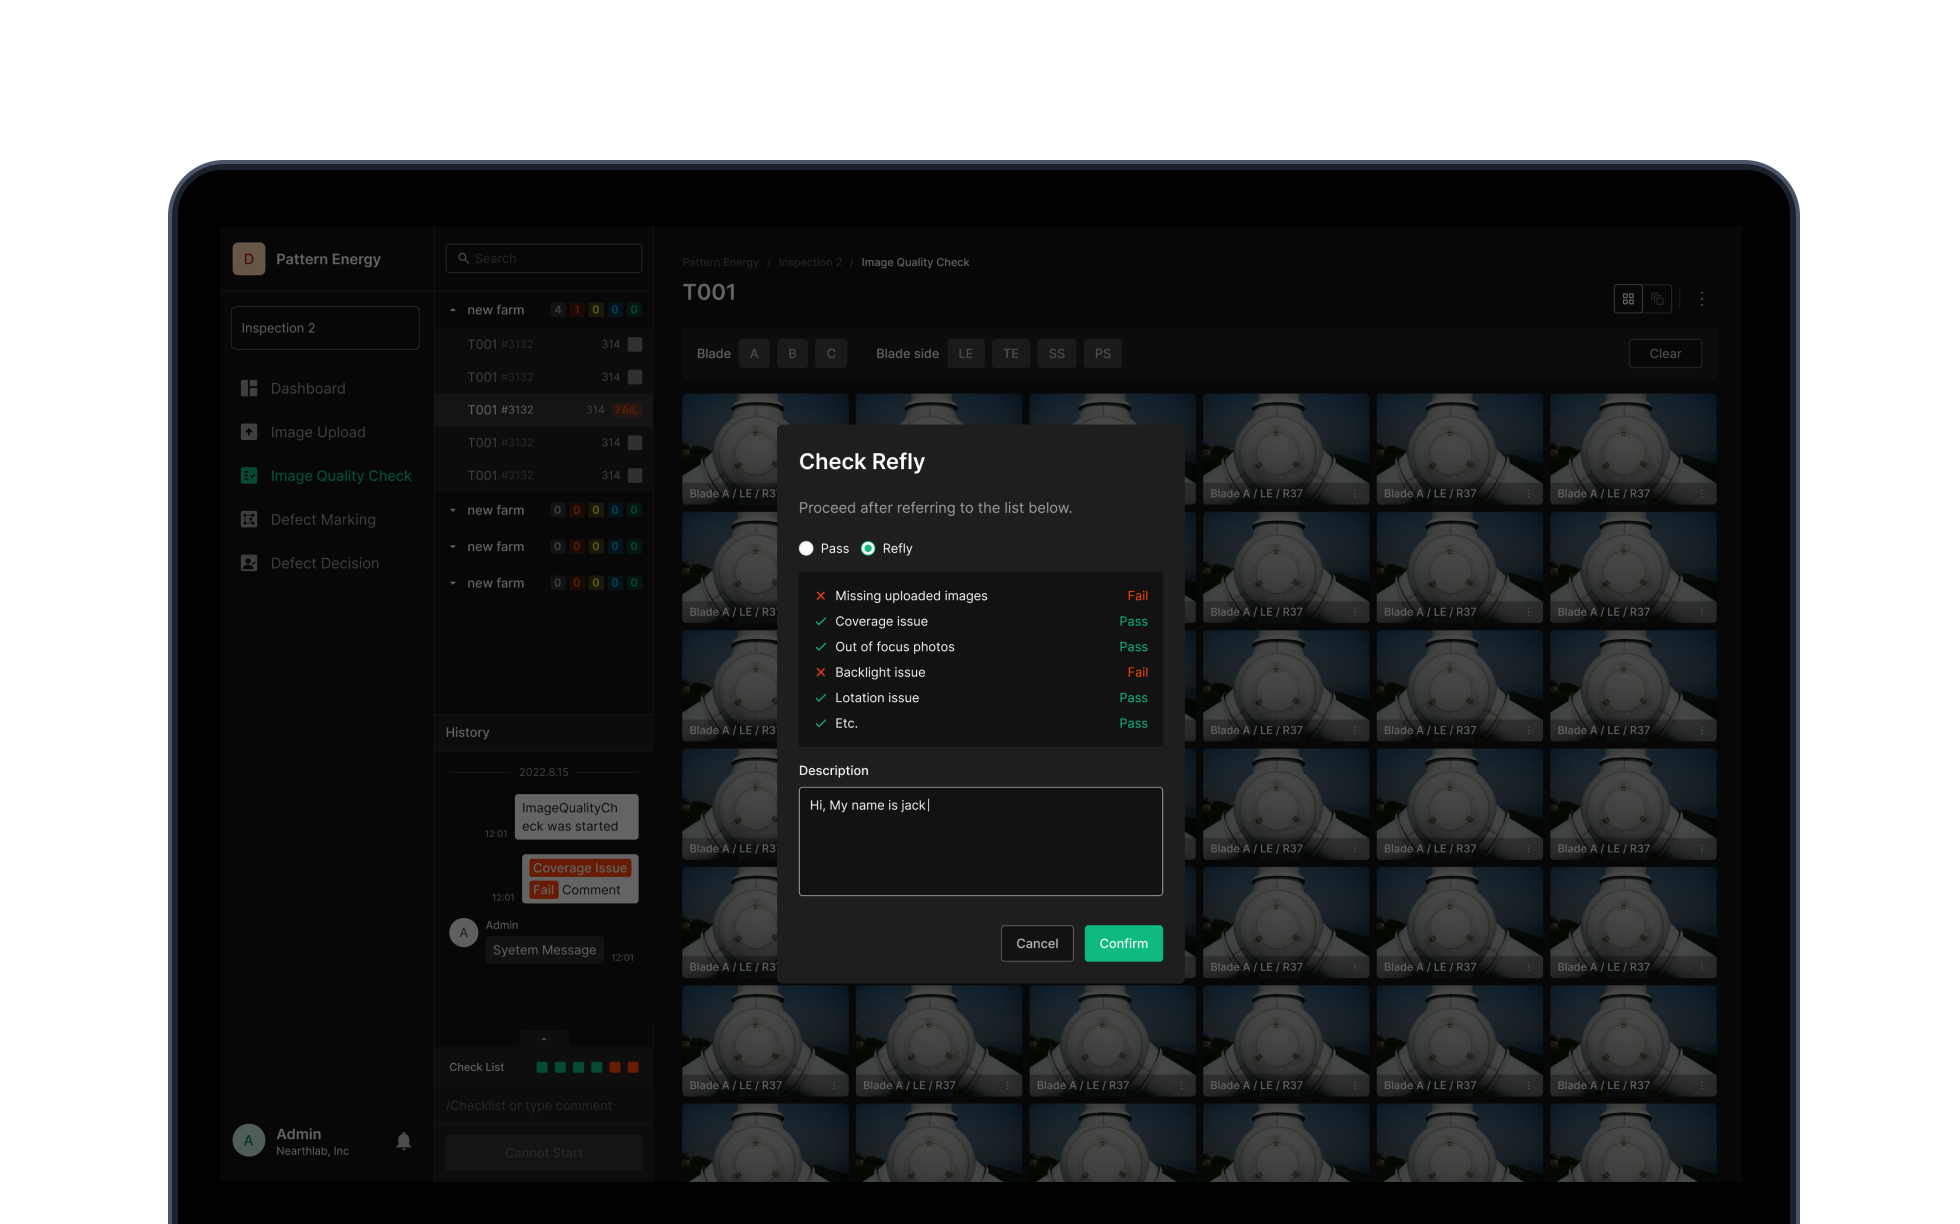
Adjust blur, brightness, and darkness to hold image quality. If quality falls below threshold, trigger a re-capture before analysis is poisoned.
Status + audit trail
Each image holds a Pass, Fail, or Review state — quality progress reads clearly. All state changes and comments log for cross-team auditing.
Core Feature 03
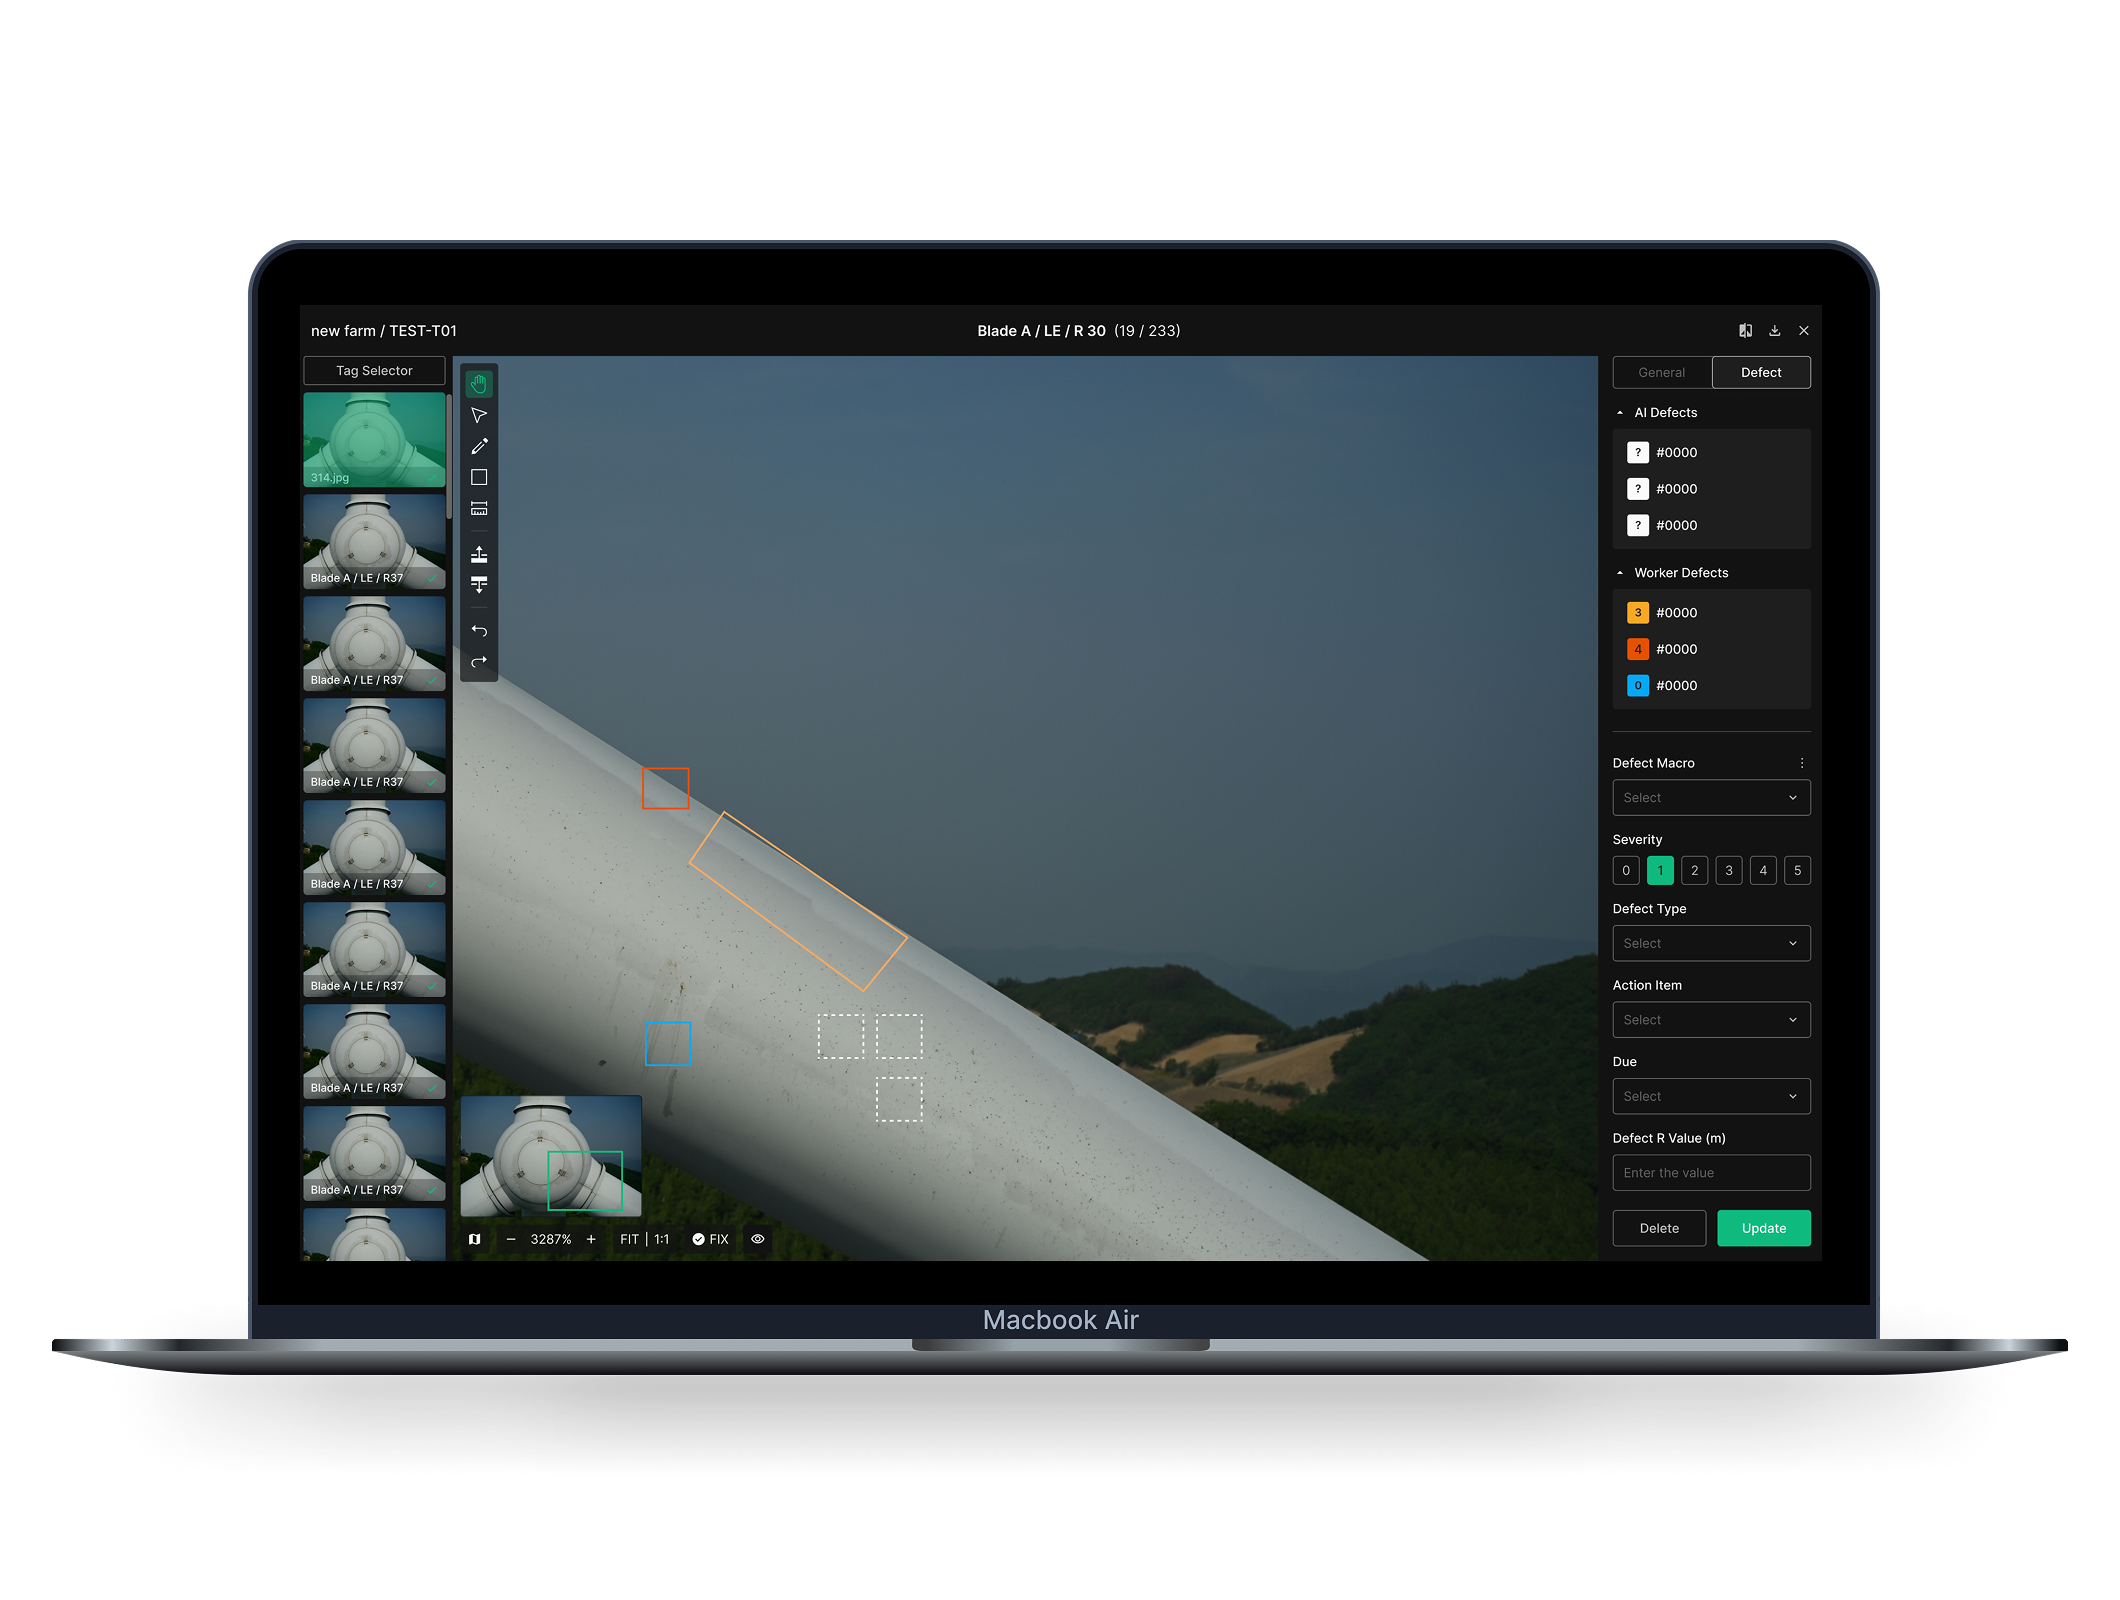
OSD Viewer
The workbench where inspectors spend most of their time. Highlight defects with B-boxes on ultra-high-resolution images, and reconcile AI-detected defects with the ones the inspector finds — all on one surface. Comparison views track defect progression over time, and image adjustment tools push detection accuracy up.
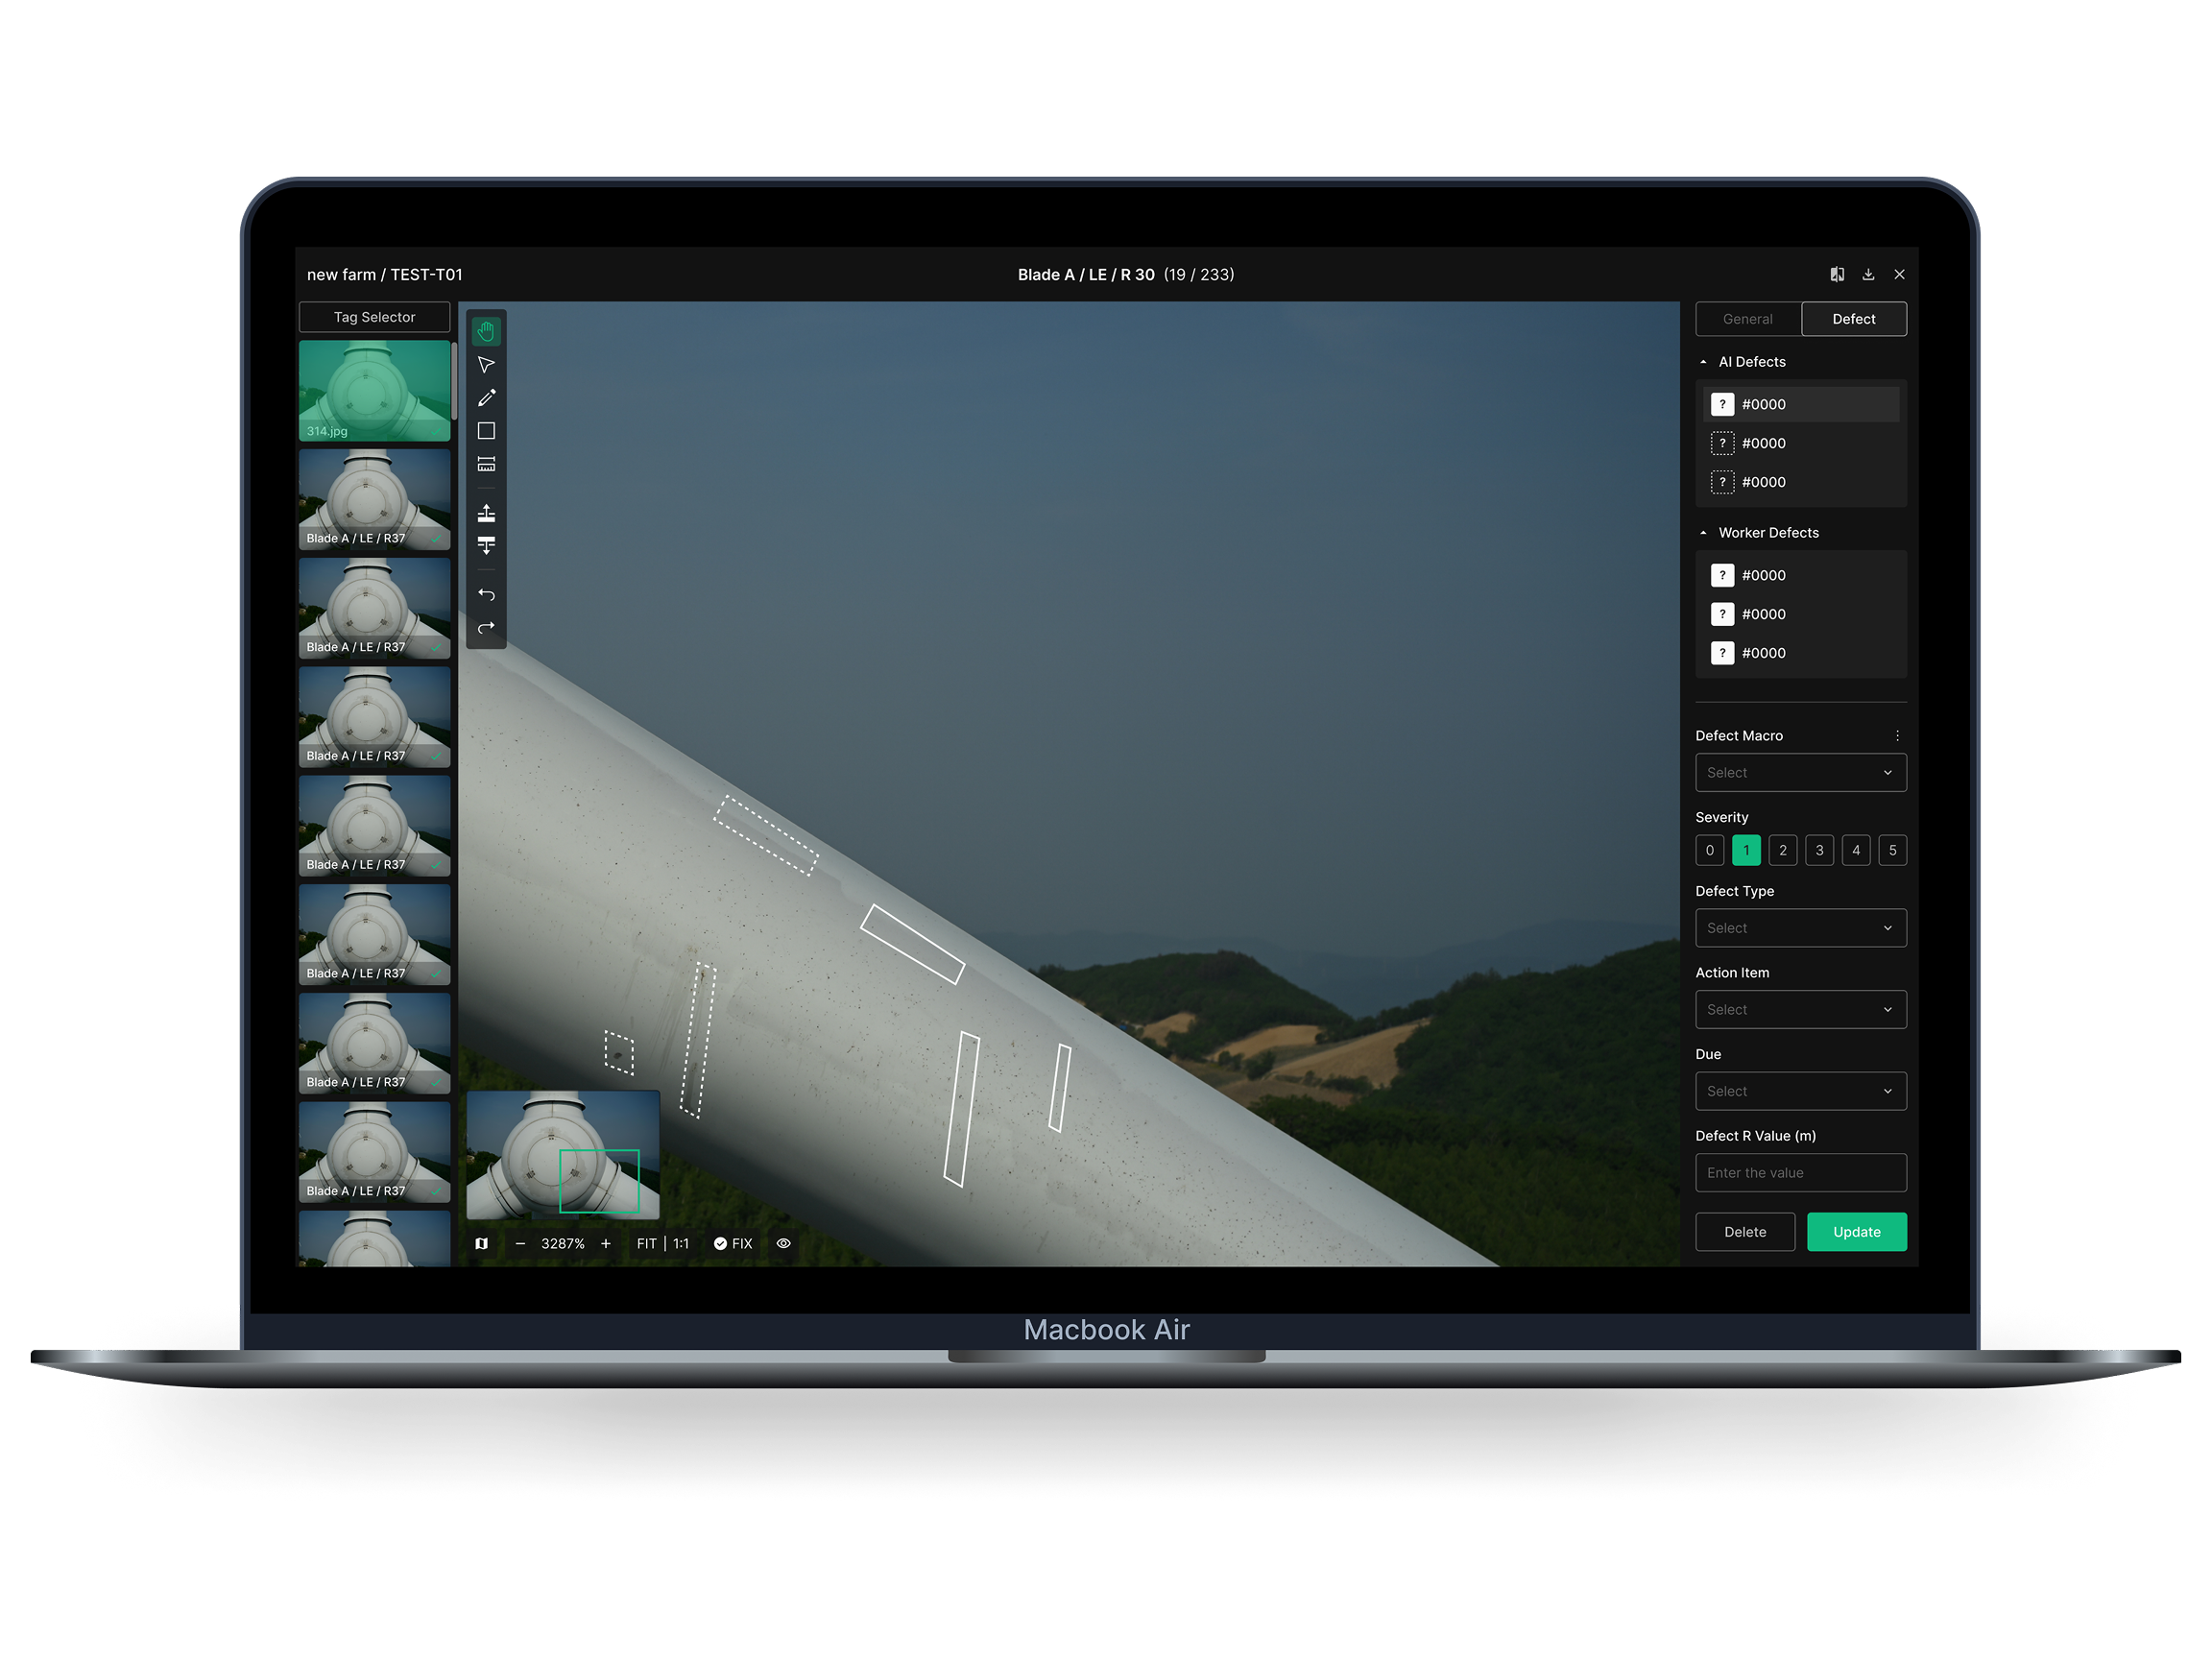
Defect identification + multi-user work
Highlight defects with B-boxes — square or non-square, sized to the defect shape. Multiple users work simultaneously, and Show/Hide cuts visual noise to a minimum.
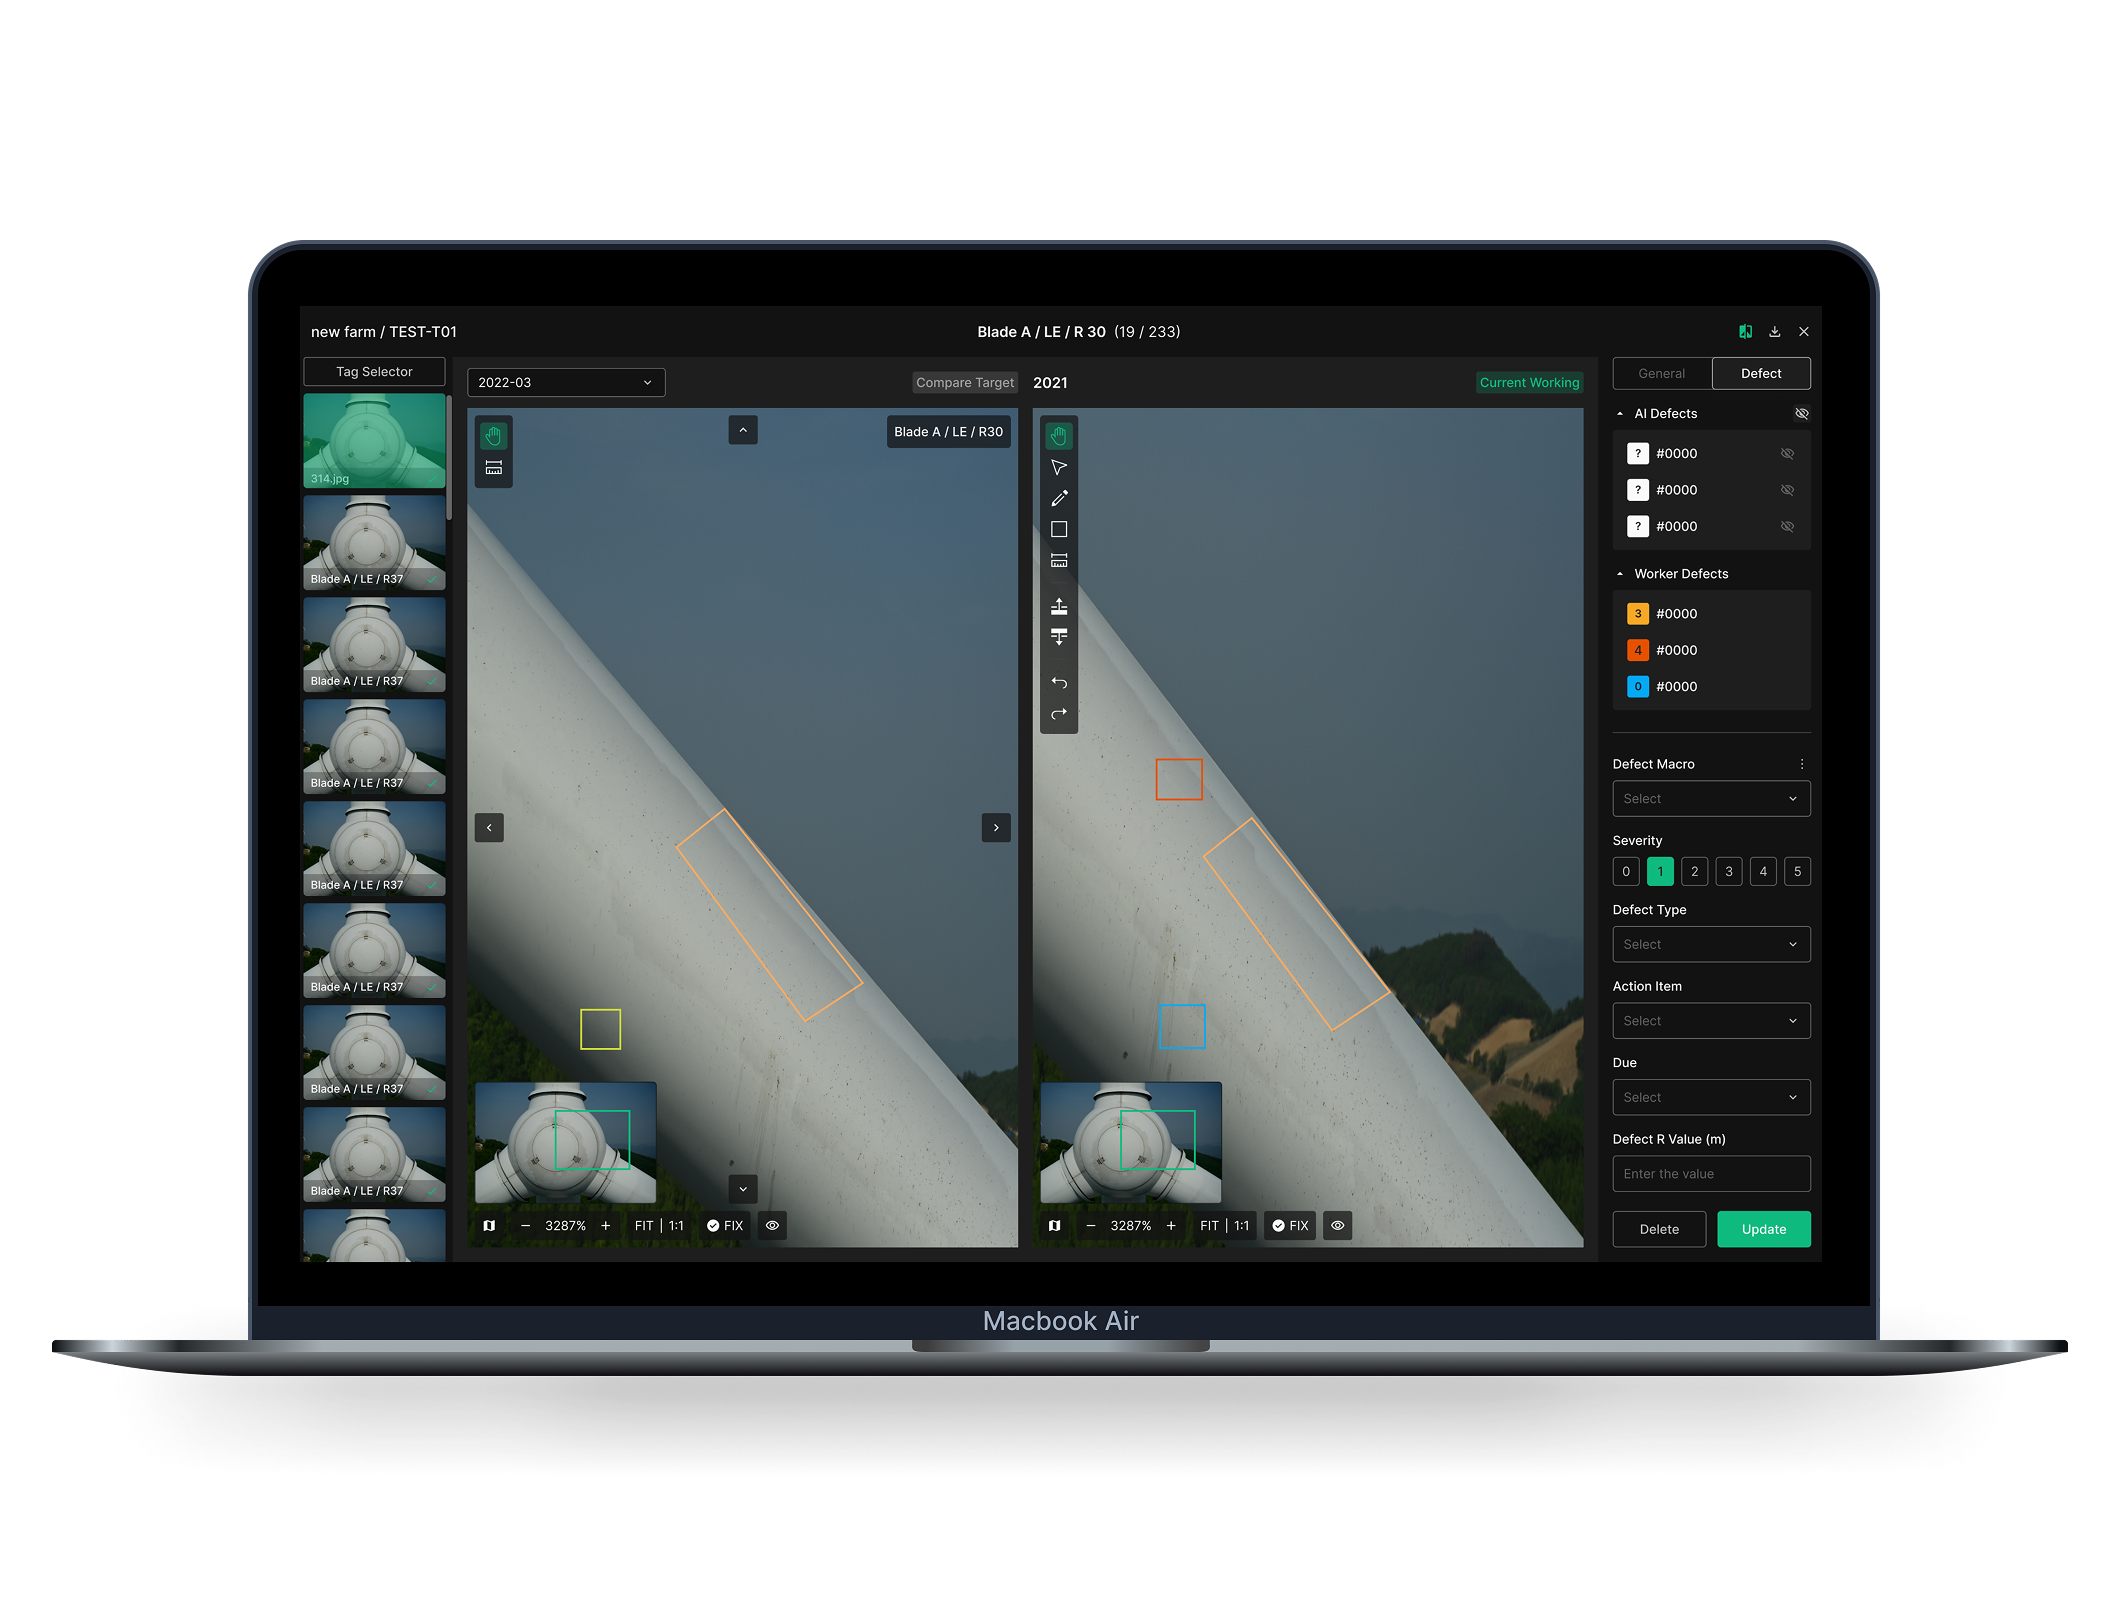
Comparison view + image adjustments
Place the current and previous inspection side by side to track defect change. Brightness, exposure, contrast, white balance — adjustment controls push the call accuracy up.
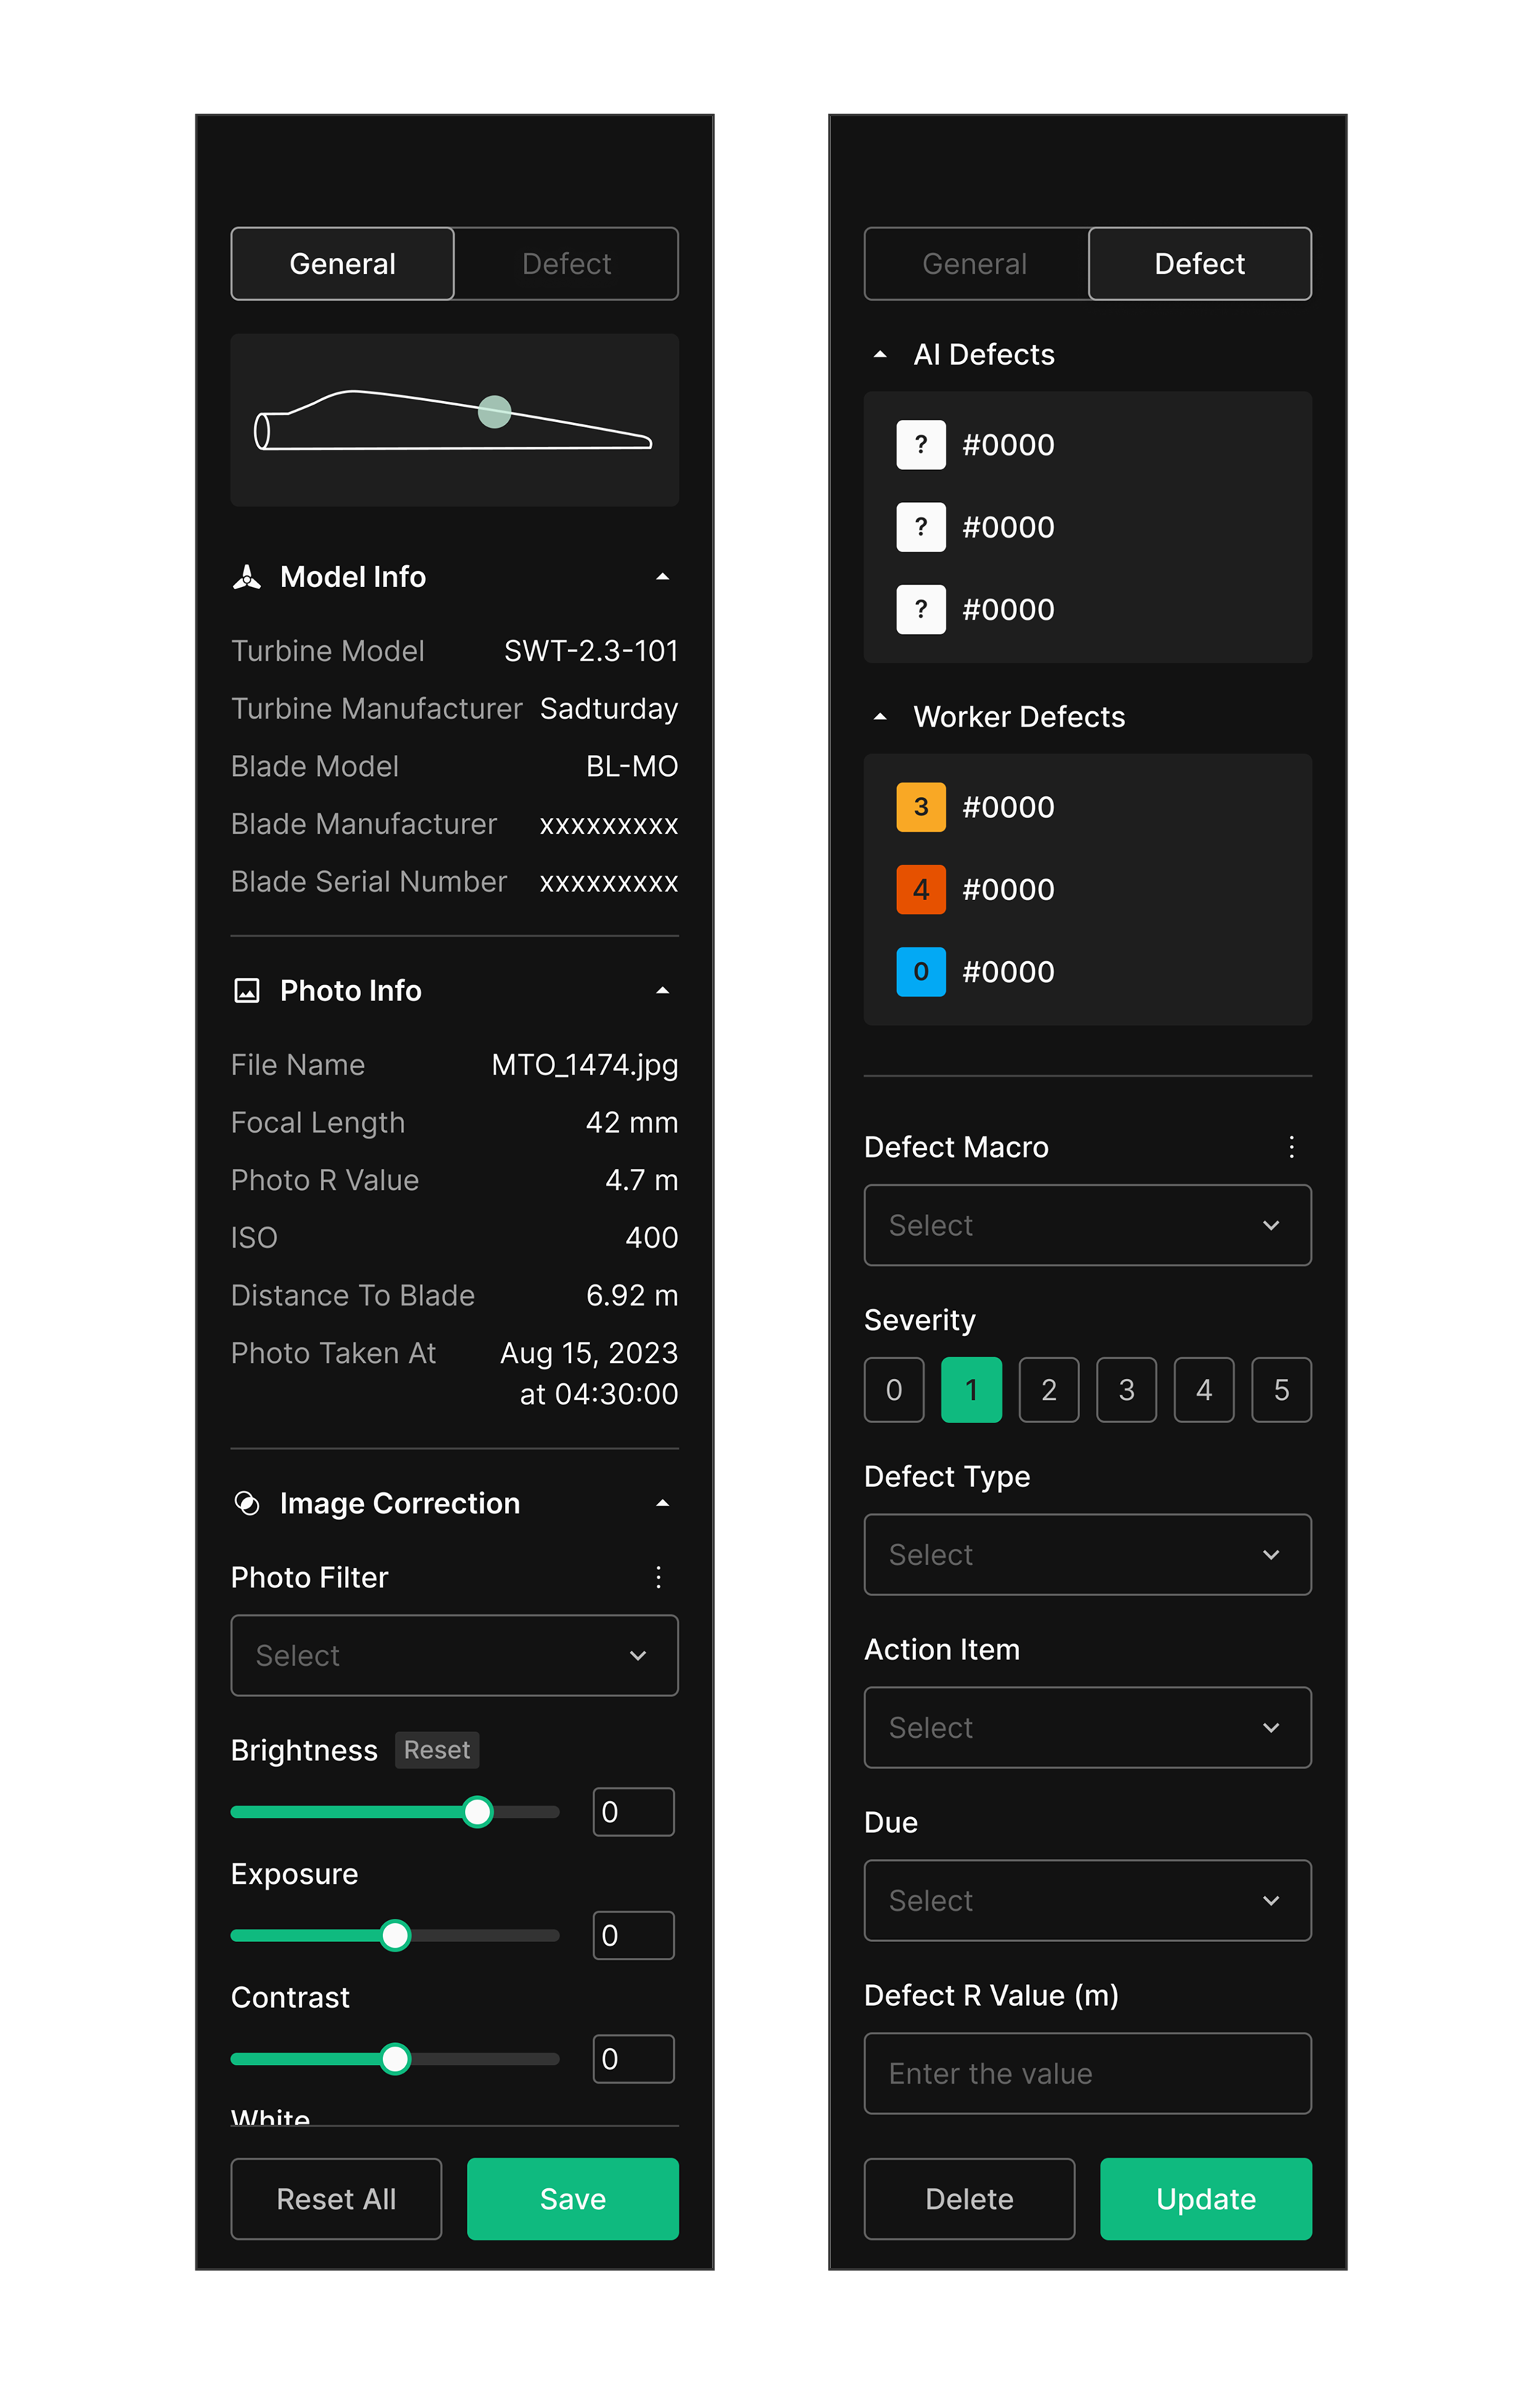
AI-assisted detection + metadata
Machine learning auto-detects defects. Turbine model, blade info, image metadata, defect severity, type, and action items all live on a single screen.
Core Feature 04
Defect Marking
The step that converts a visual finding into structured operational data. Inspectors mark up defects directly on the image — pen, highlight, shape tools — and classify by type and severity. The structured data that gets produced here is what powers final decisions and reports.
Marking + classification
Mark up defects directly on the image or in the workspace. Use the right tools to record defect type, position, and severity in a clean, recoverable structure.
Collaboration + real-time feedback
Multiple users review and edit defects in the same workspace. Real-time comments support cross-team communication, and defect frequency and pattern feed into quality improvement.
Report integration
Auto-generated defect reports give managers a top-down read on overall quality state. Export to PDF or Excel for external sharing and documentation.
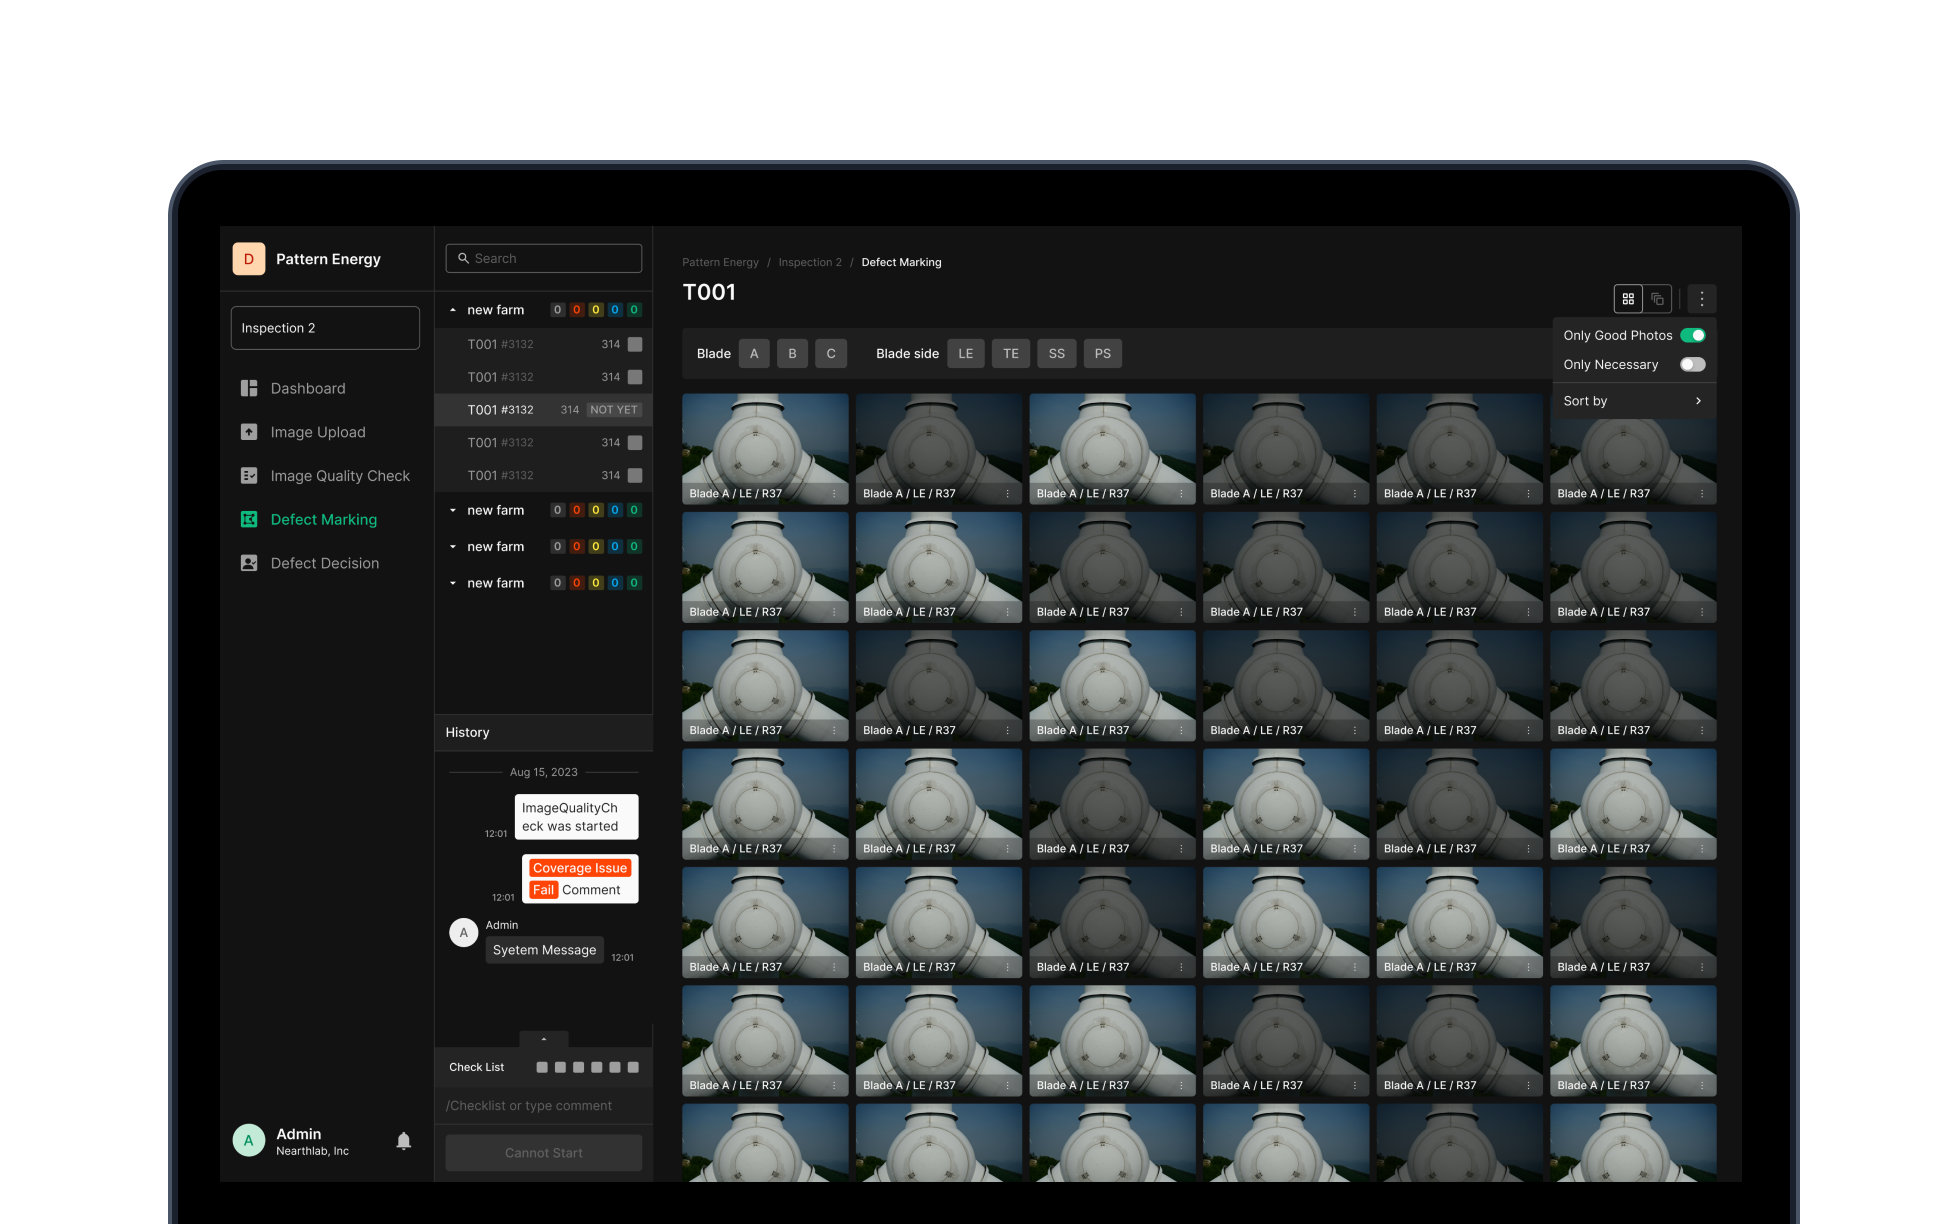
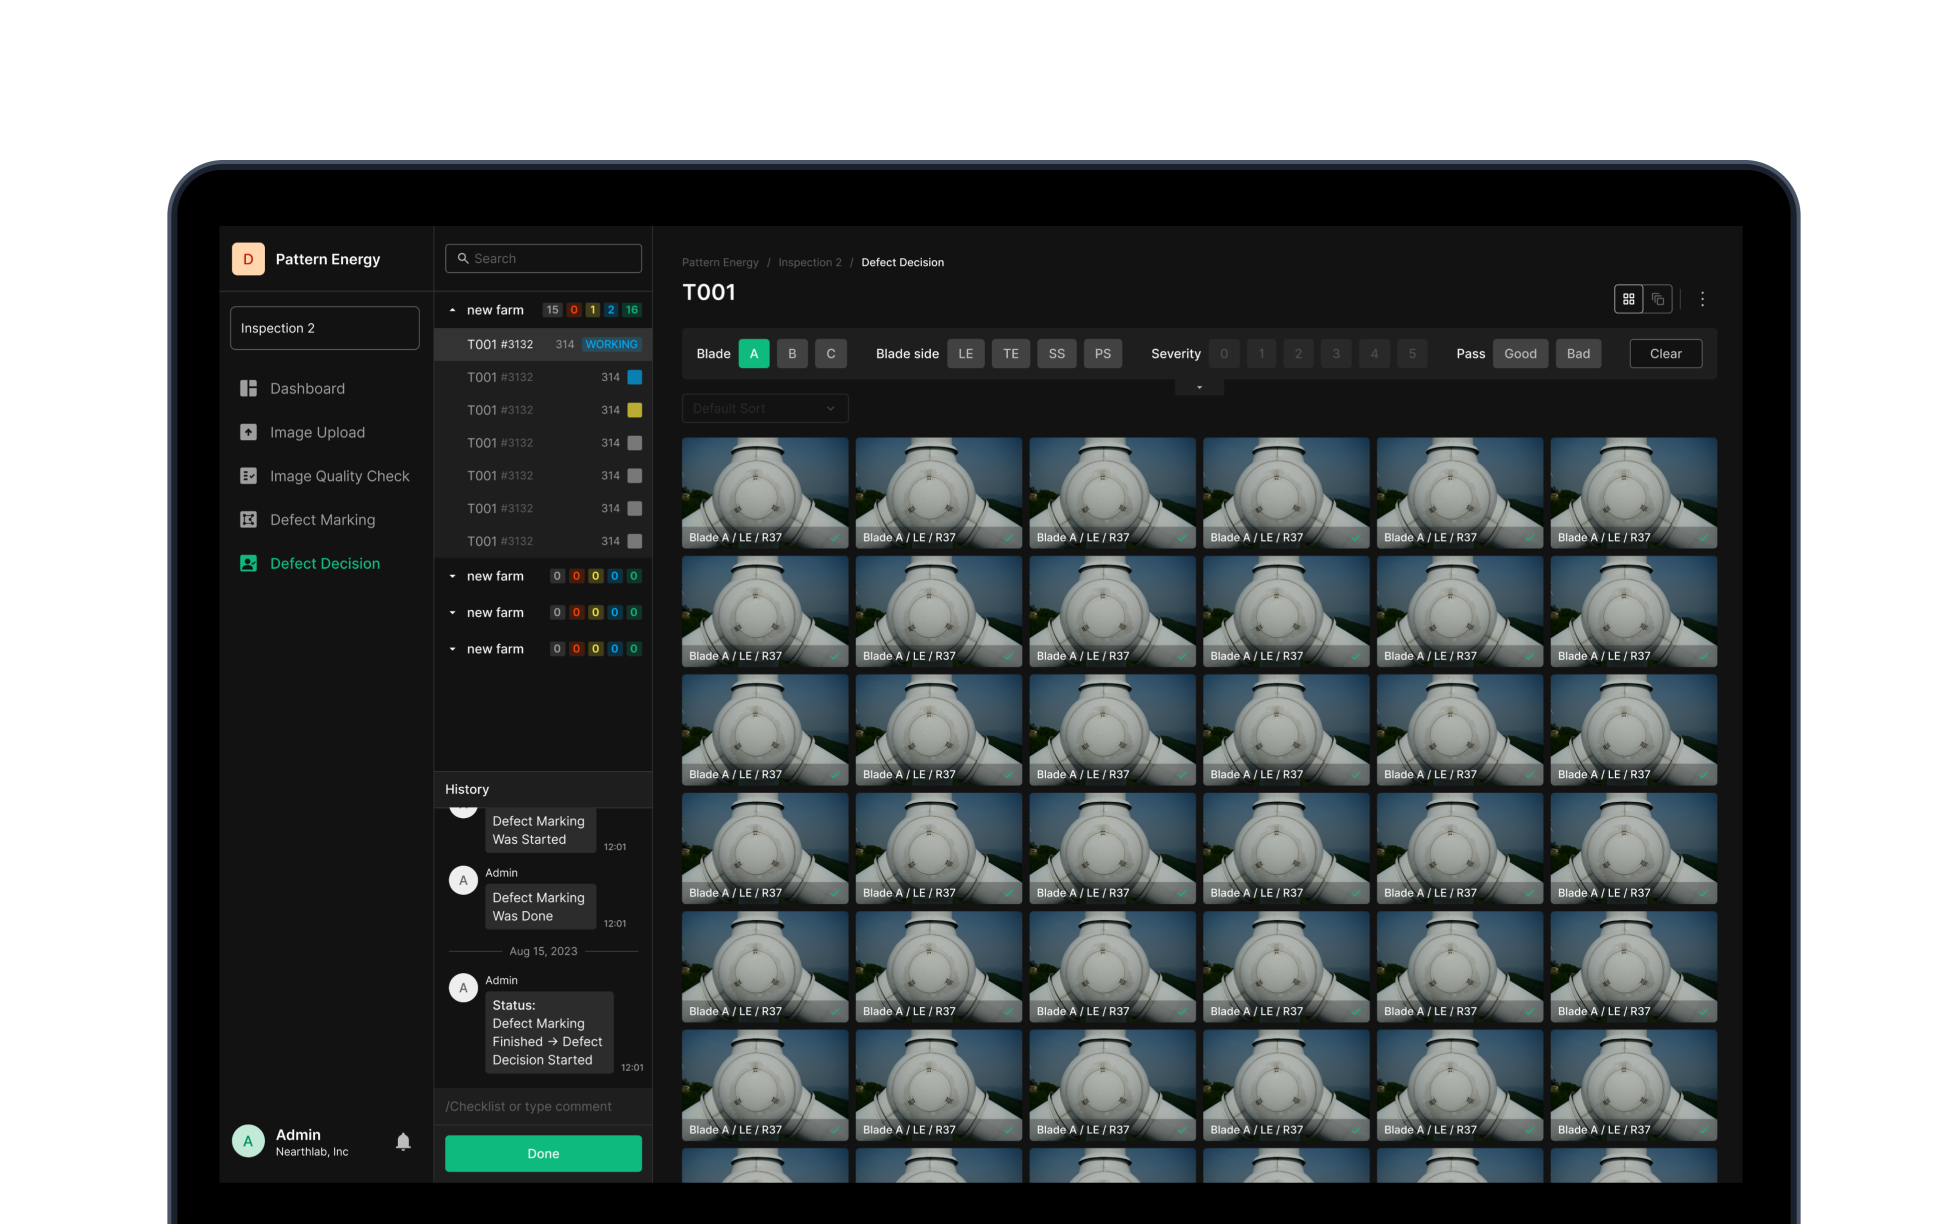
Core Feature 05
Defect Decision
The final judgment gate before a marked defect turns into a repair order. Filter by blade type (A, B, C) and defect position (LE, TE, SS, PS), evaluate severity, and lock in Pass, Good, or Bad. Every decision logs for transparency.
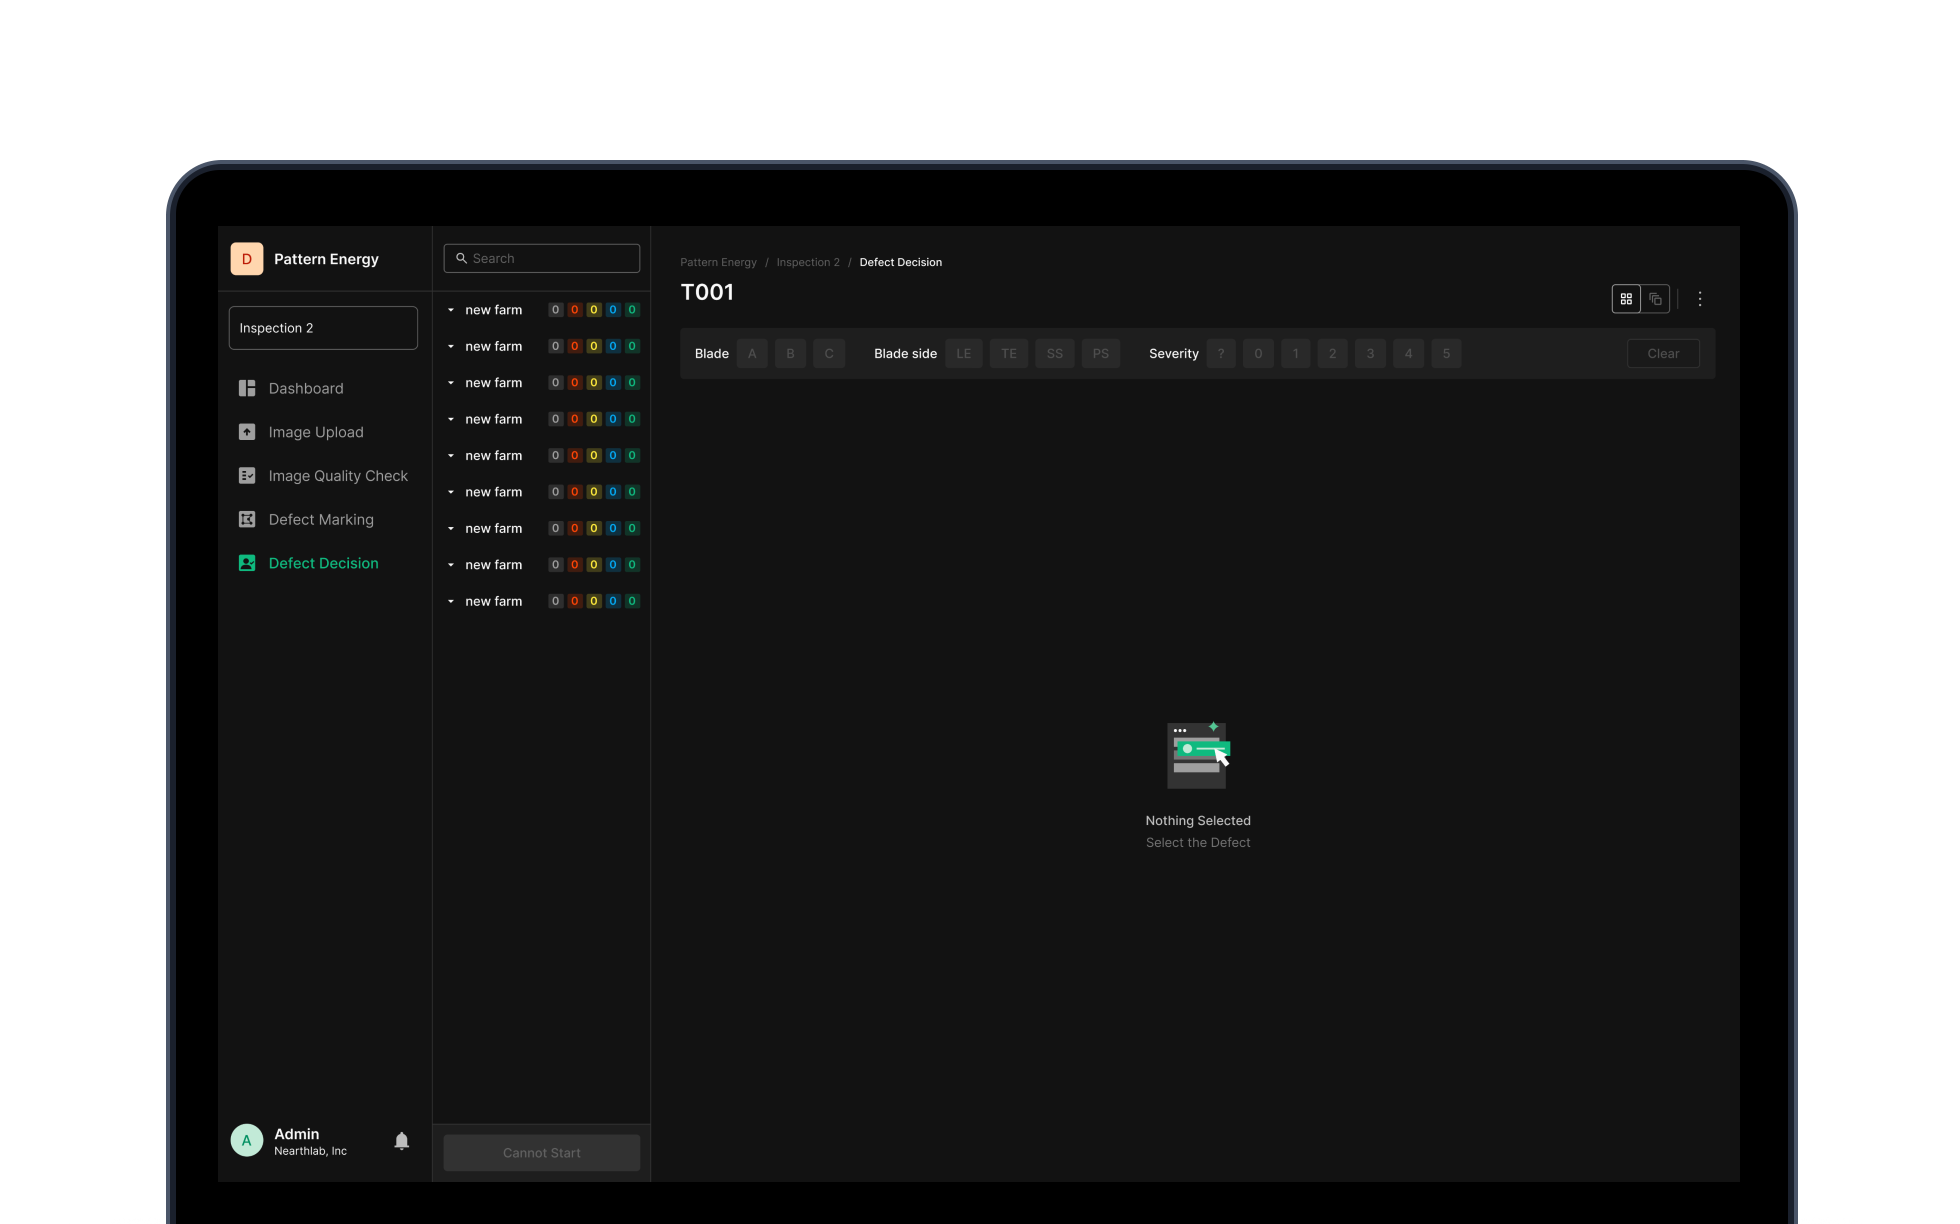
Defect list + filtering
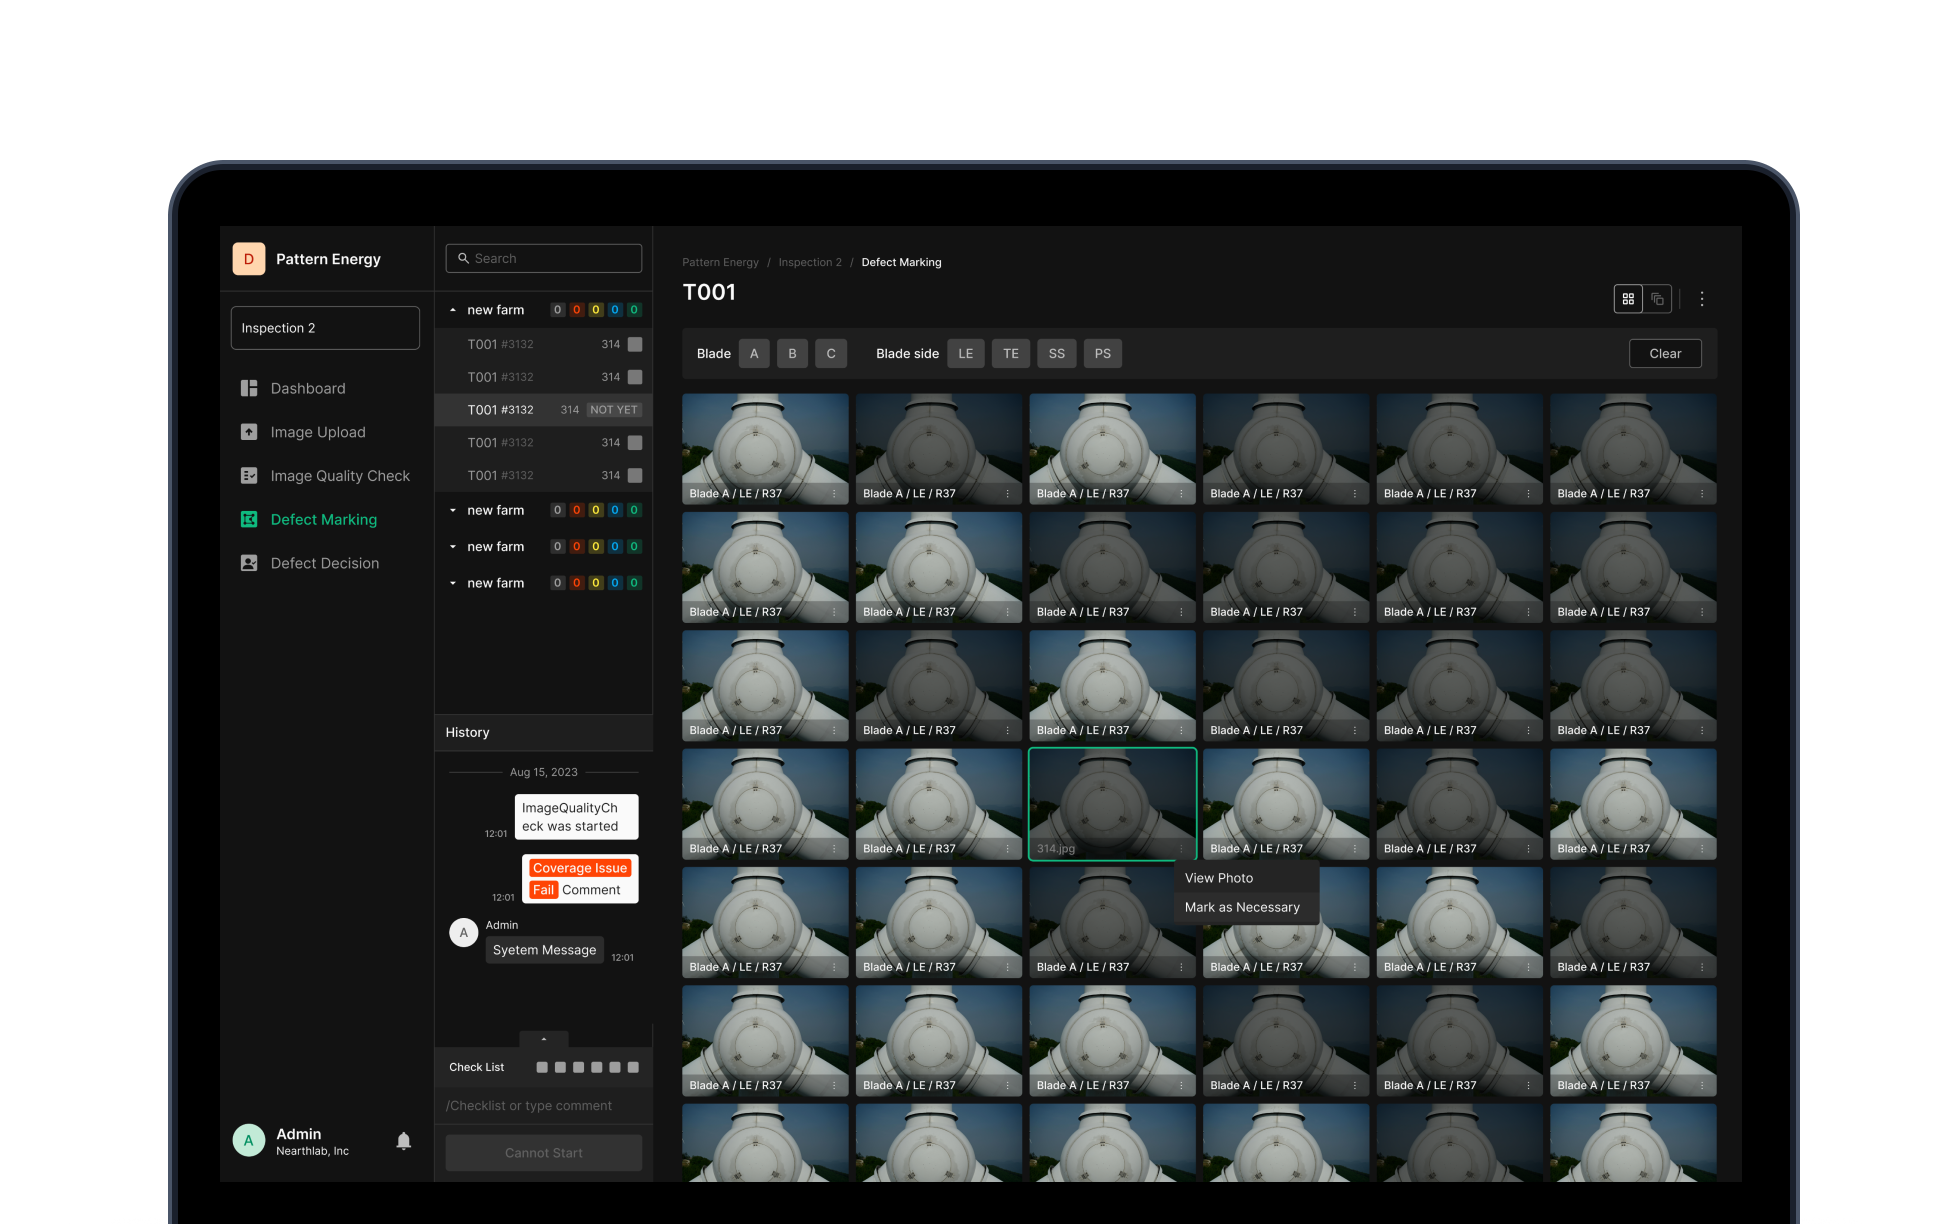
See every defect photo on the selected blade. Filter by blade type and defect position, sort by severity — review the urgent defects first.
Final call + edit
Lock each defect as Pass, Good, or Bad. Zoom into the defect photo for detail review and edit the marking on the spot when needed — the call lands accurately.
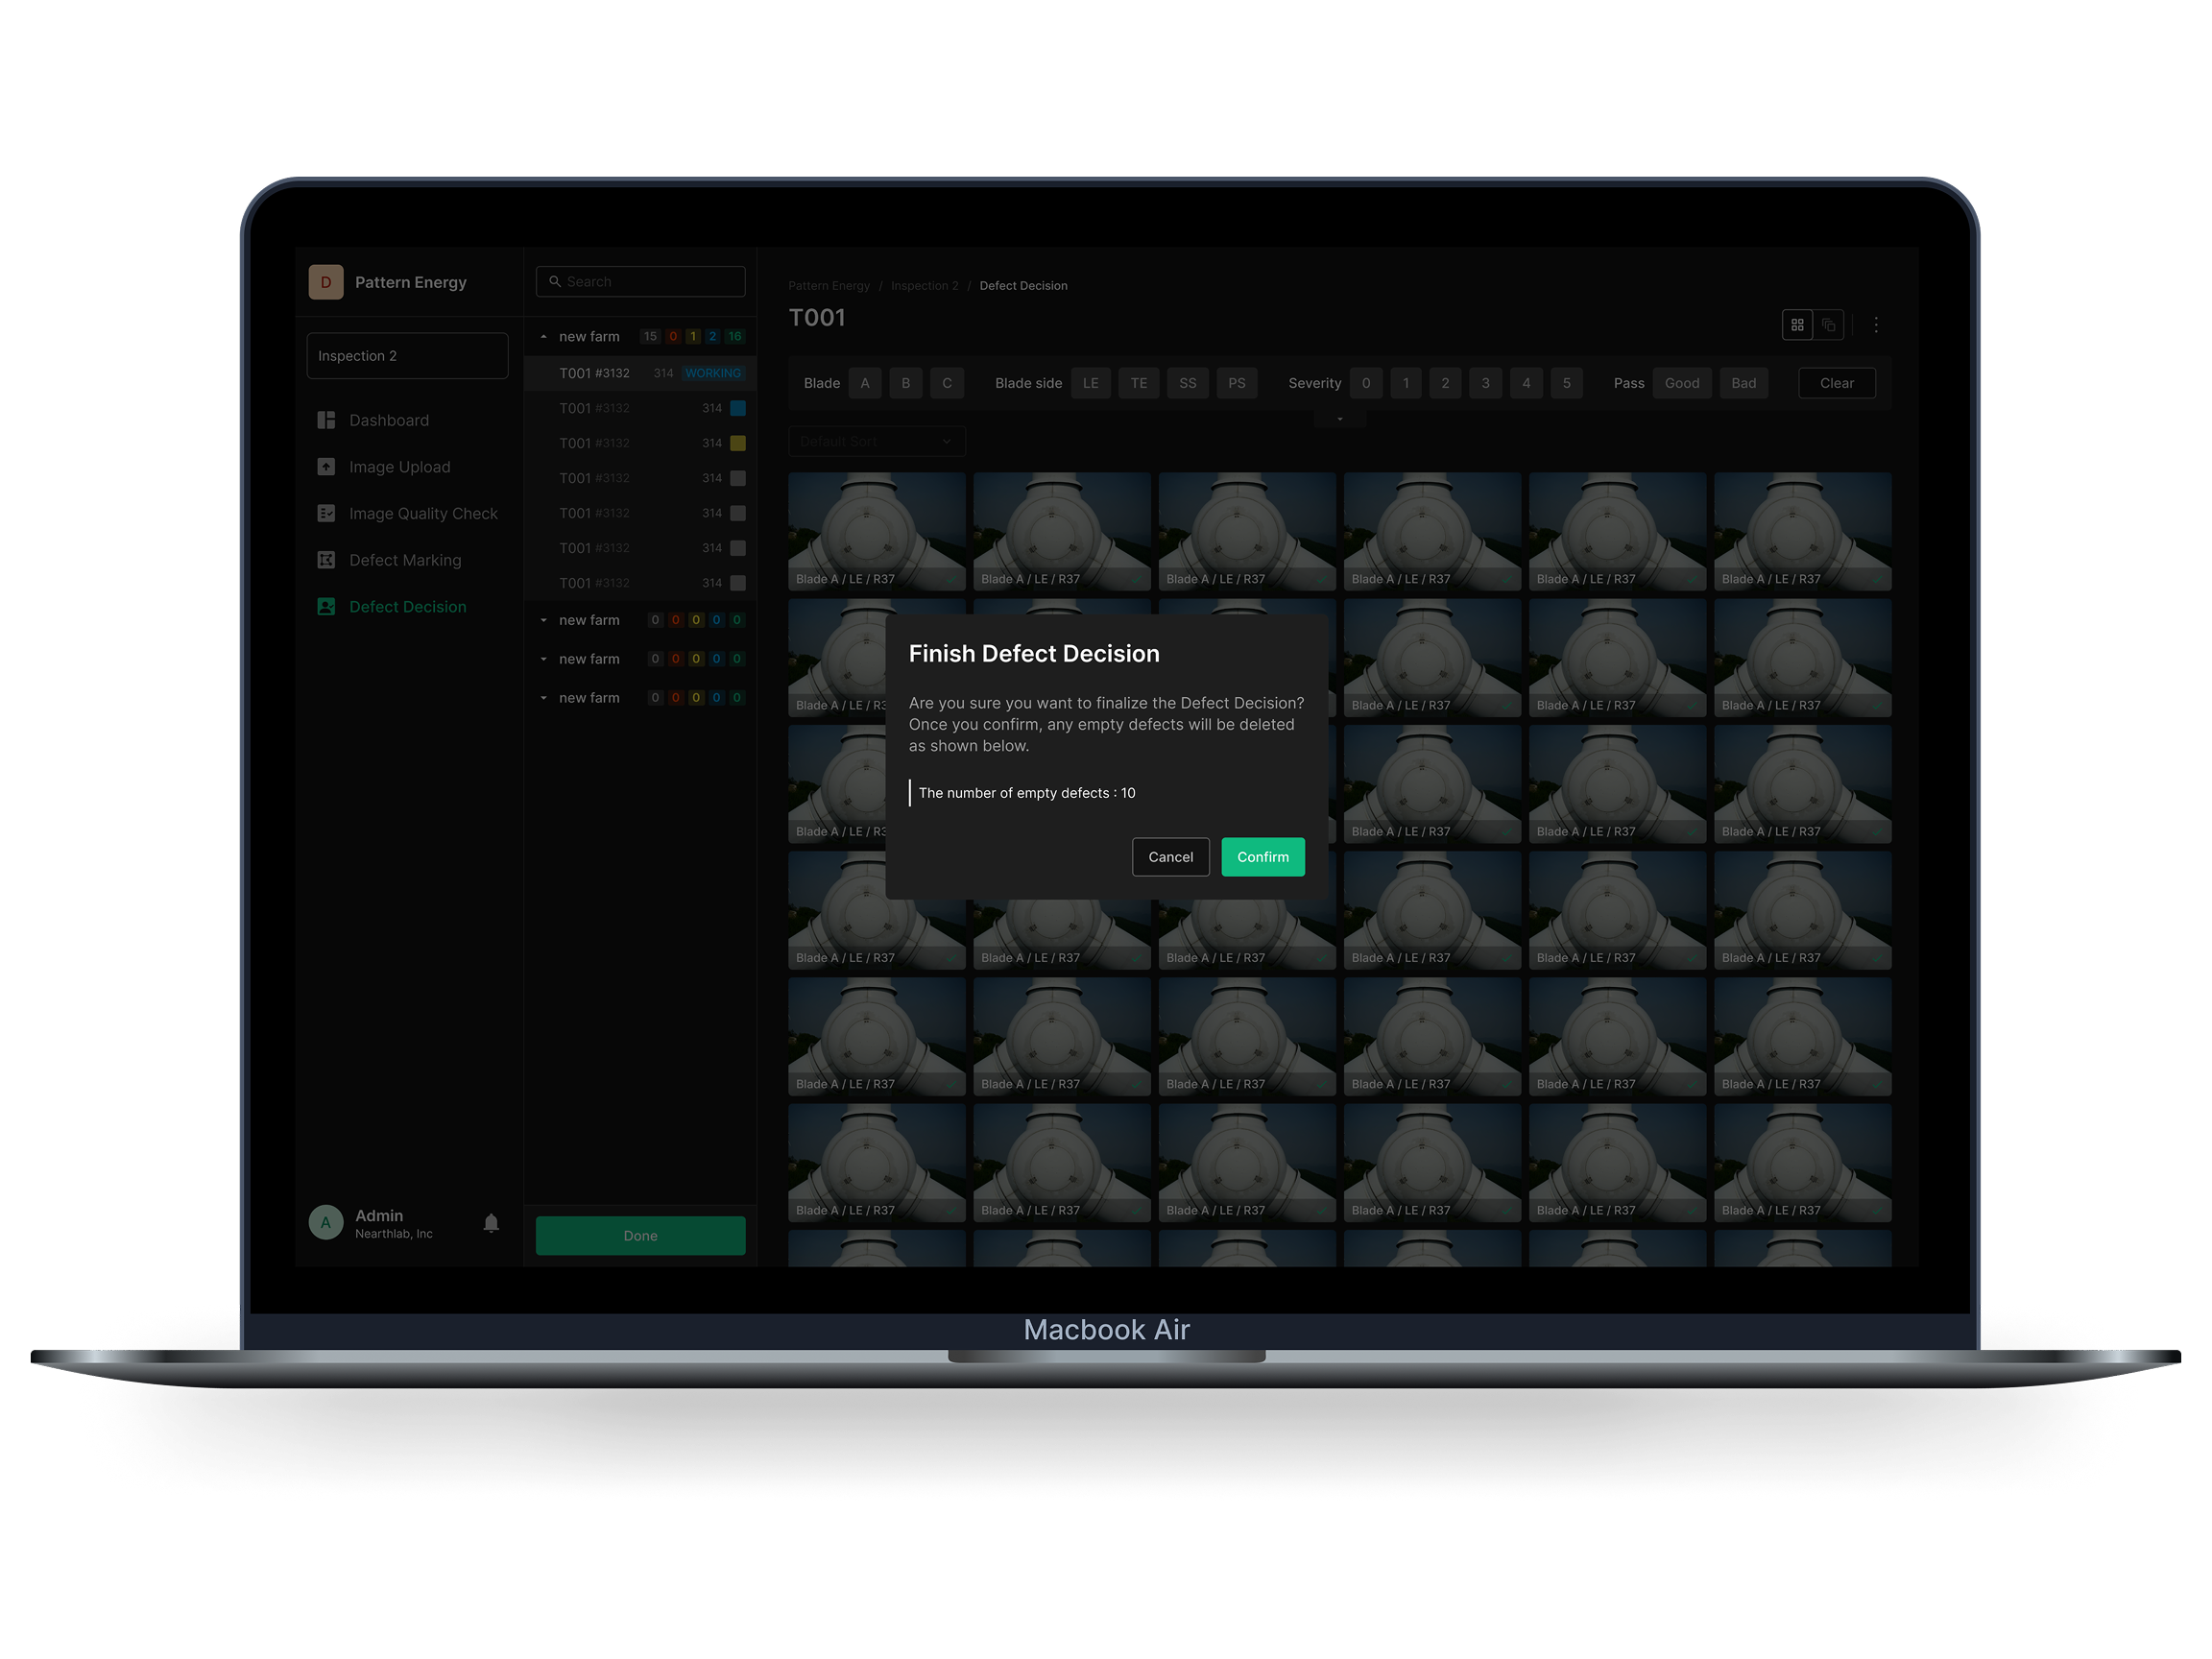
Decision audit trail
Decision and edit history logs for full transparency. Empty defects get counted before final lock-in, and a confirmation step prevents missed calls.
Core Feature 06
Dashboard & Notification
The operational hub where a distributed team coordinates inspection work across multiple wind farms in real time. Read and change every farm's DIU (Drone Inspection Unit) status from one screen, and a unified notification system resolves the time and distance gap.
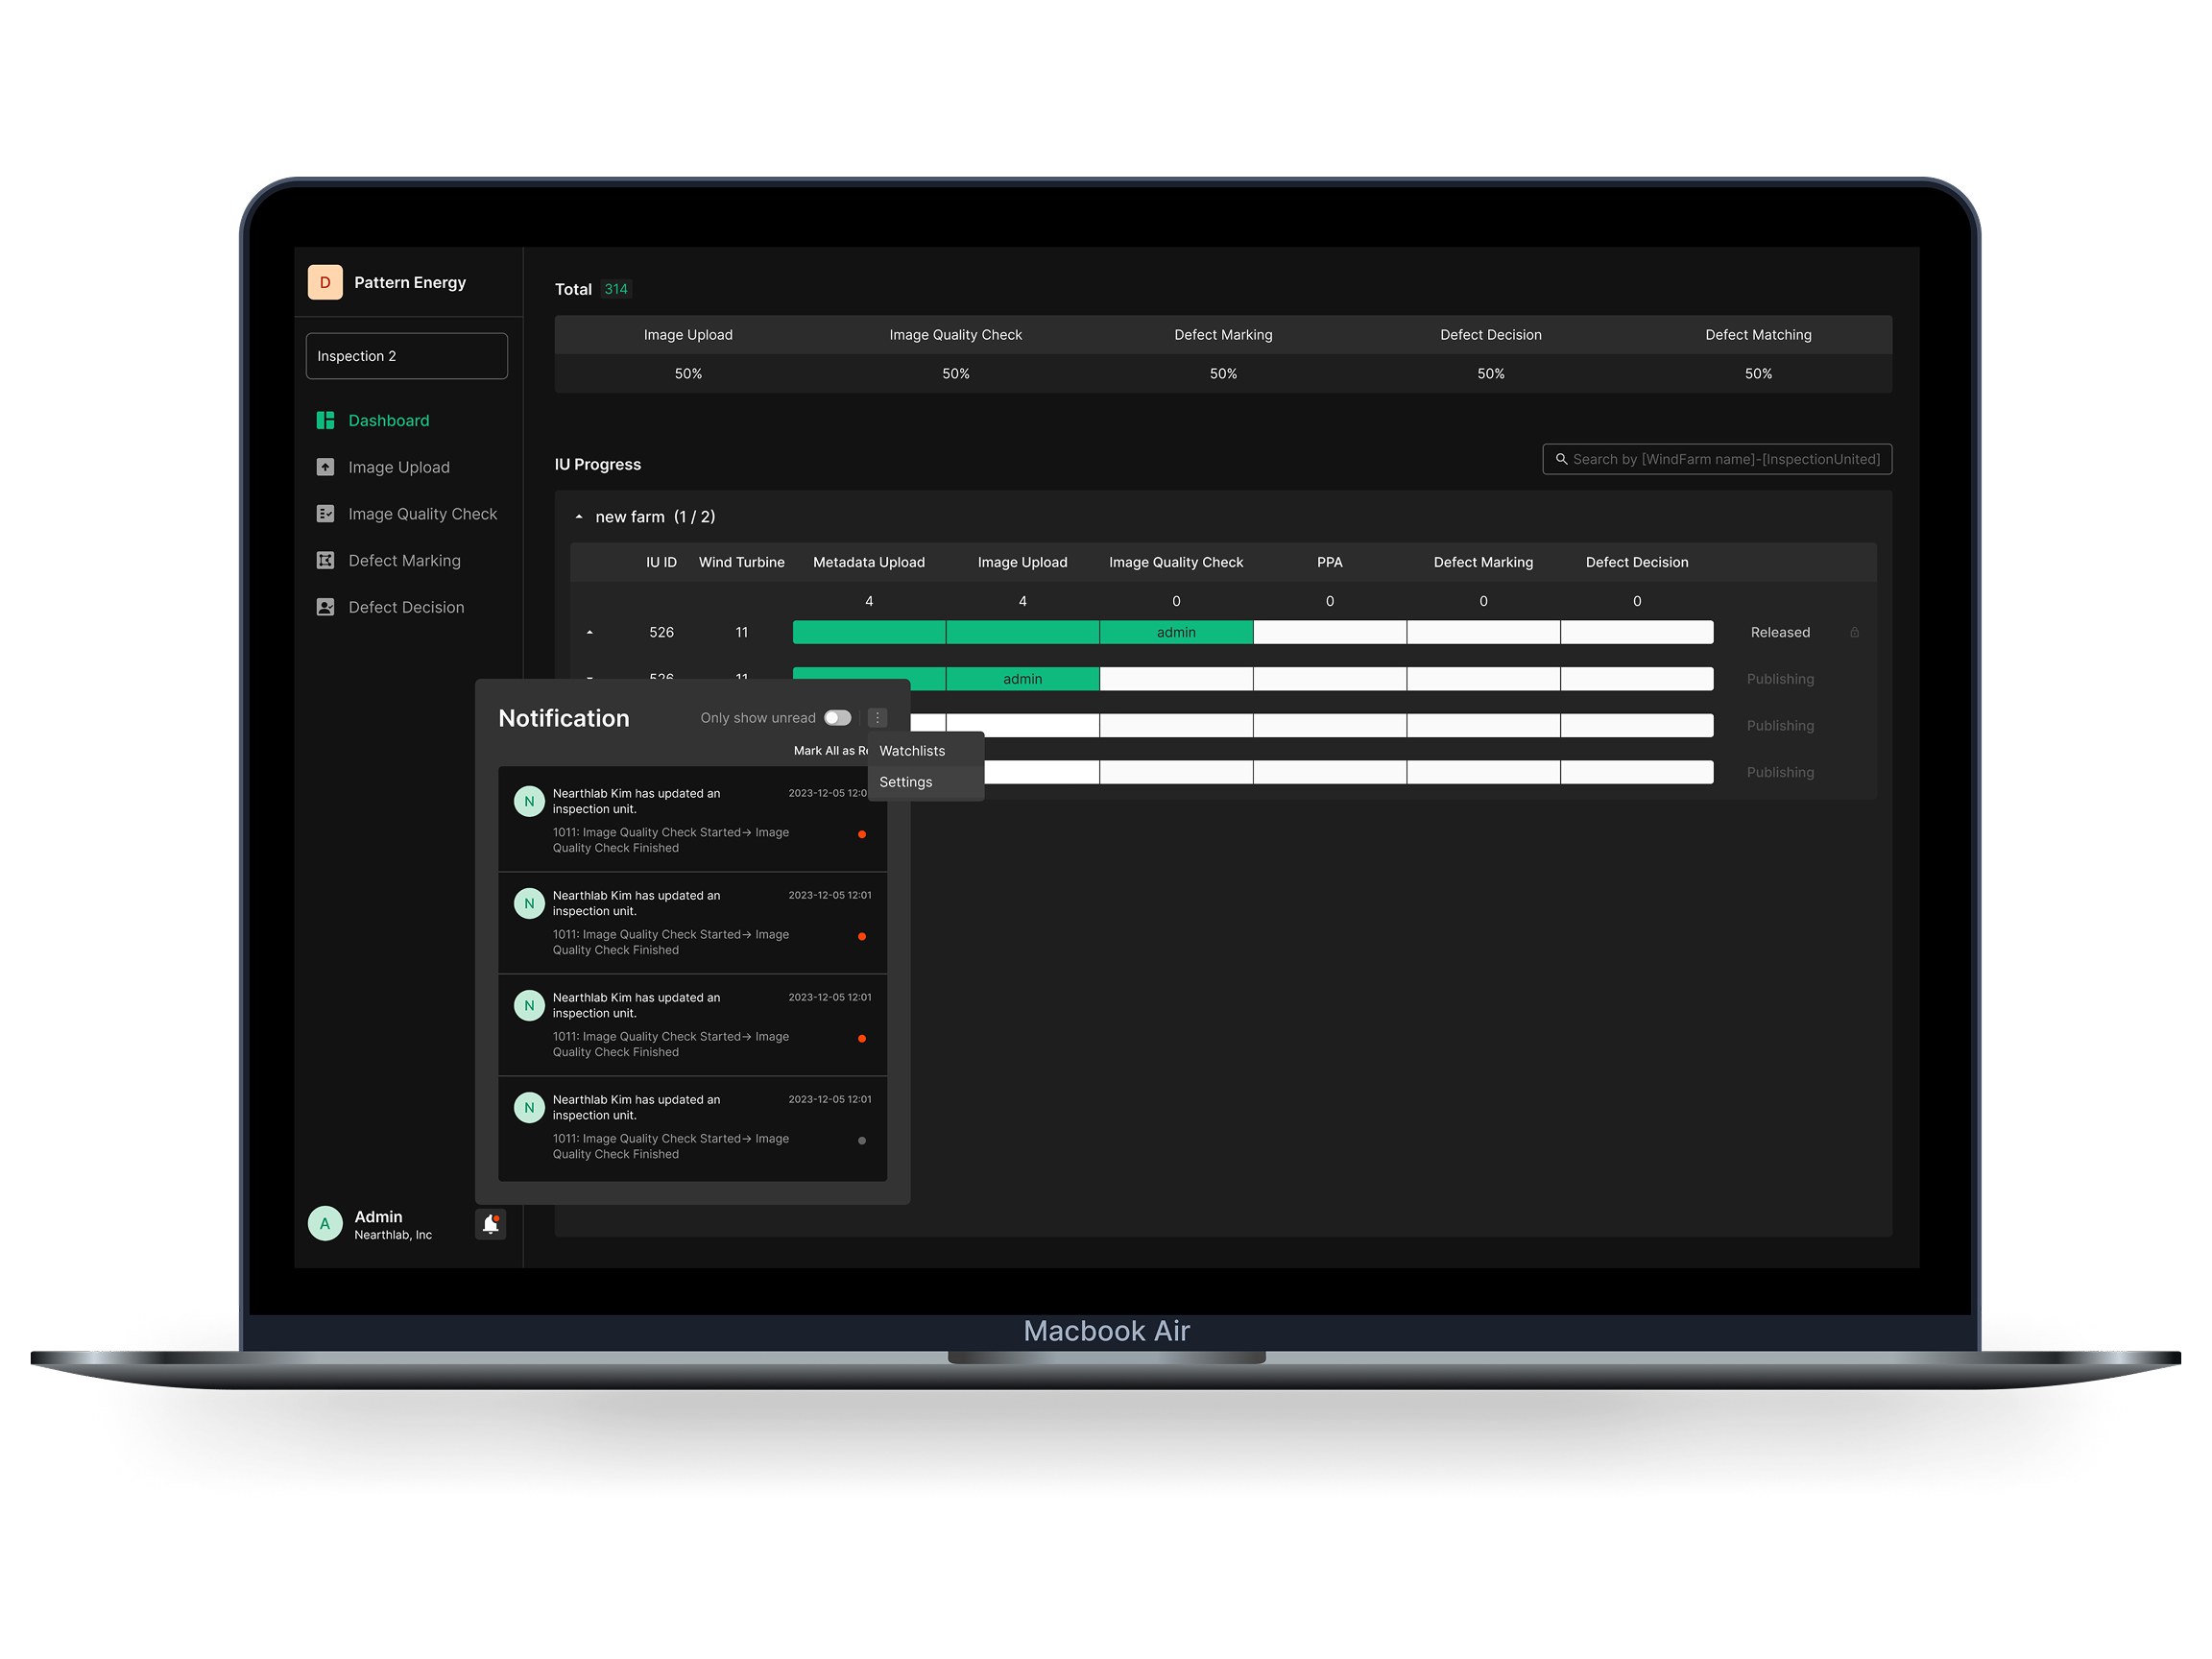
Real-time work status
Read and change DIU work status across multiple farms live. Status indicators, change buttons, and assignment tools coordinate cross-team work without friction.
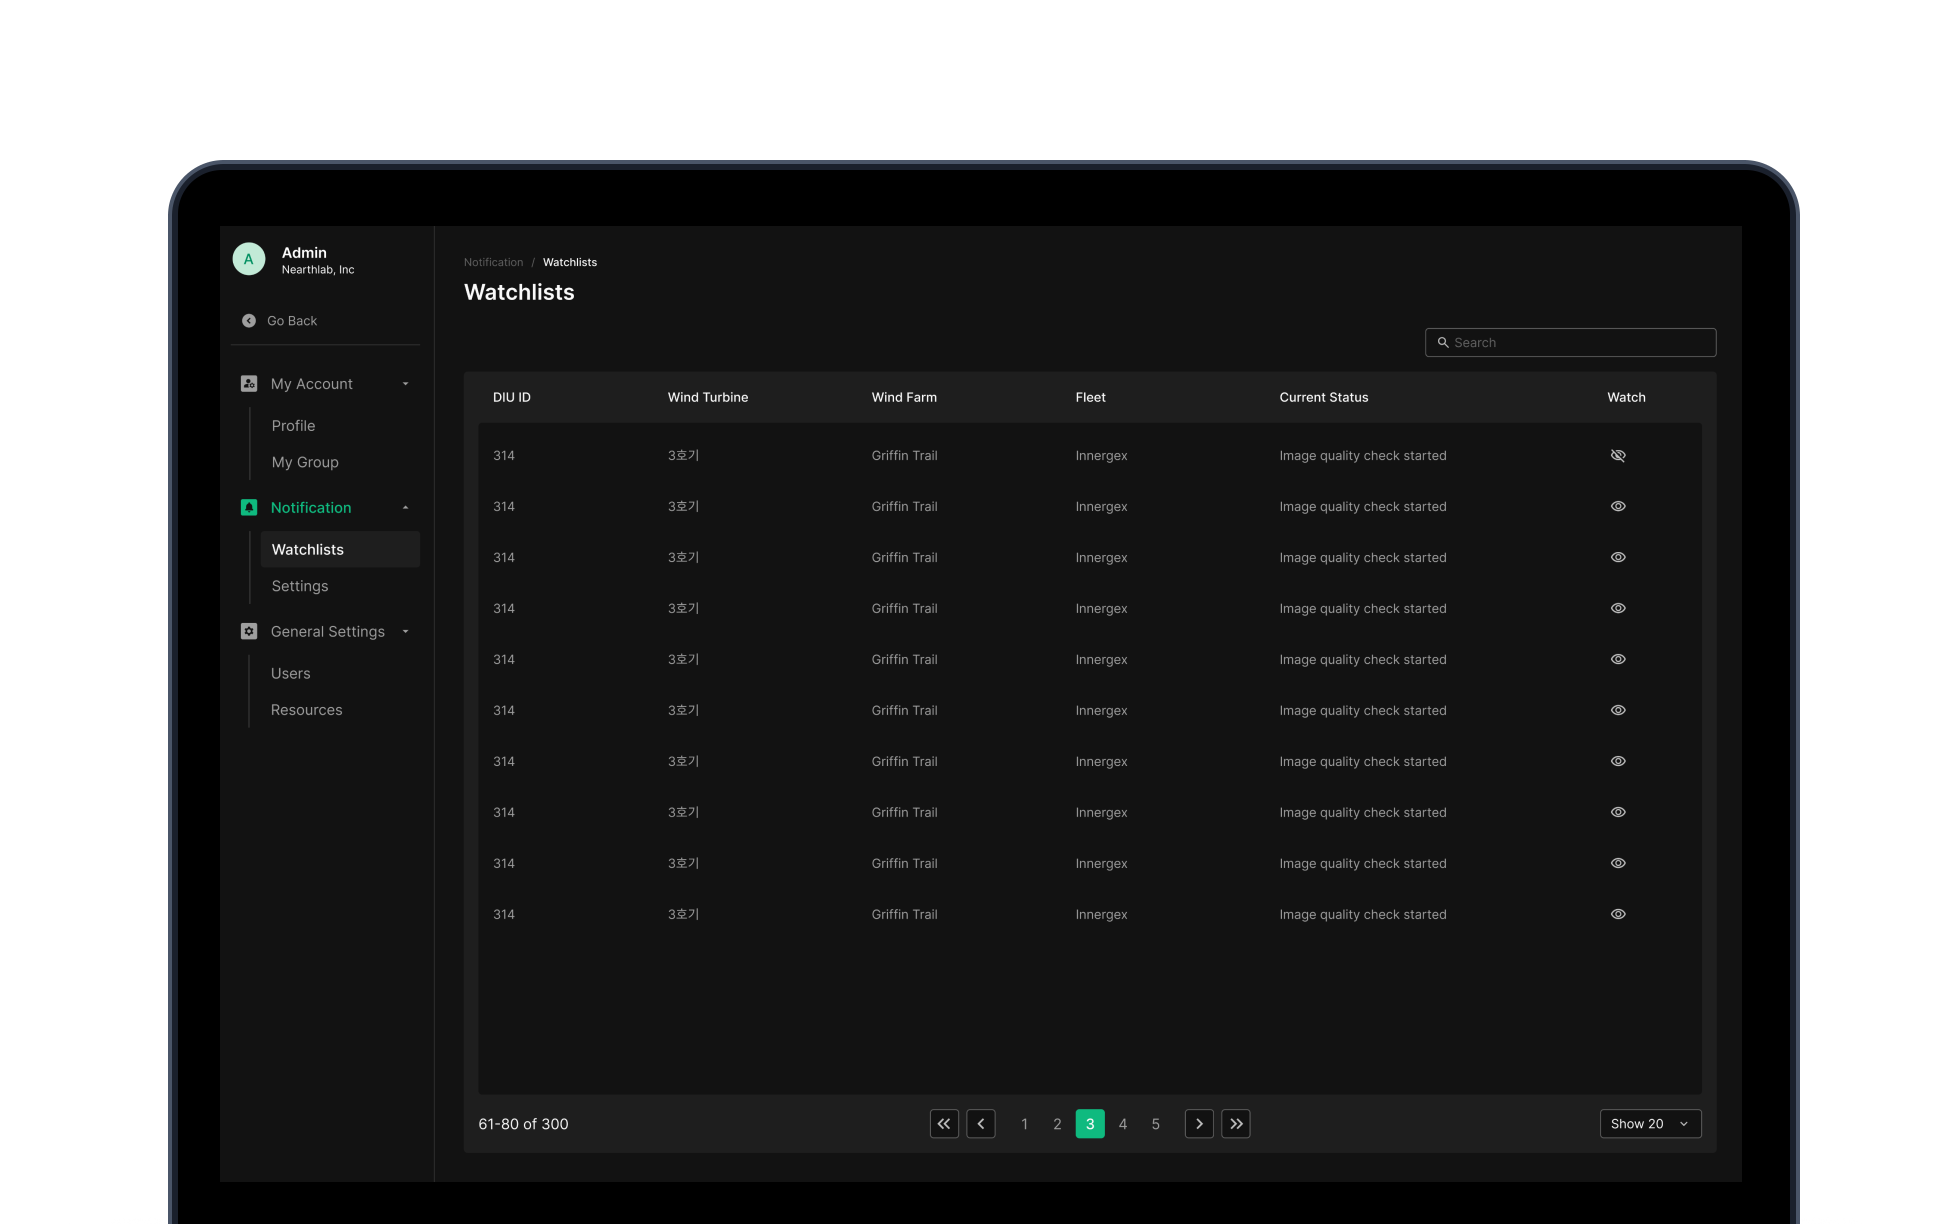
Unified notifications + Watch
Email and in-app notifications when work status changes. Notification on/off and Watch let you track the things you care about without missing changes.
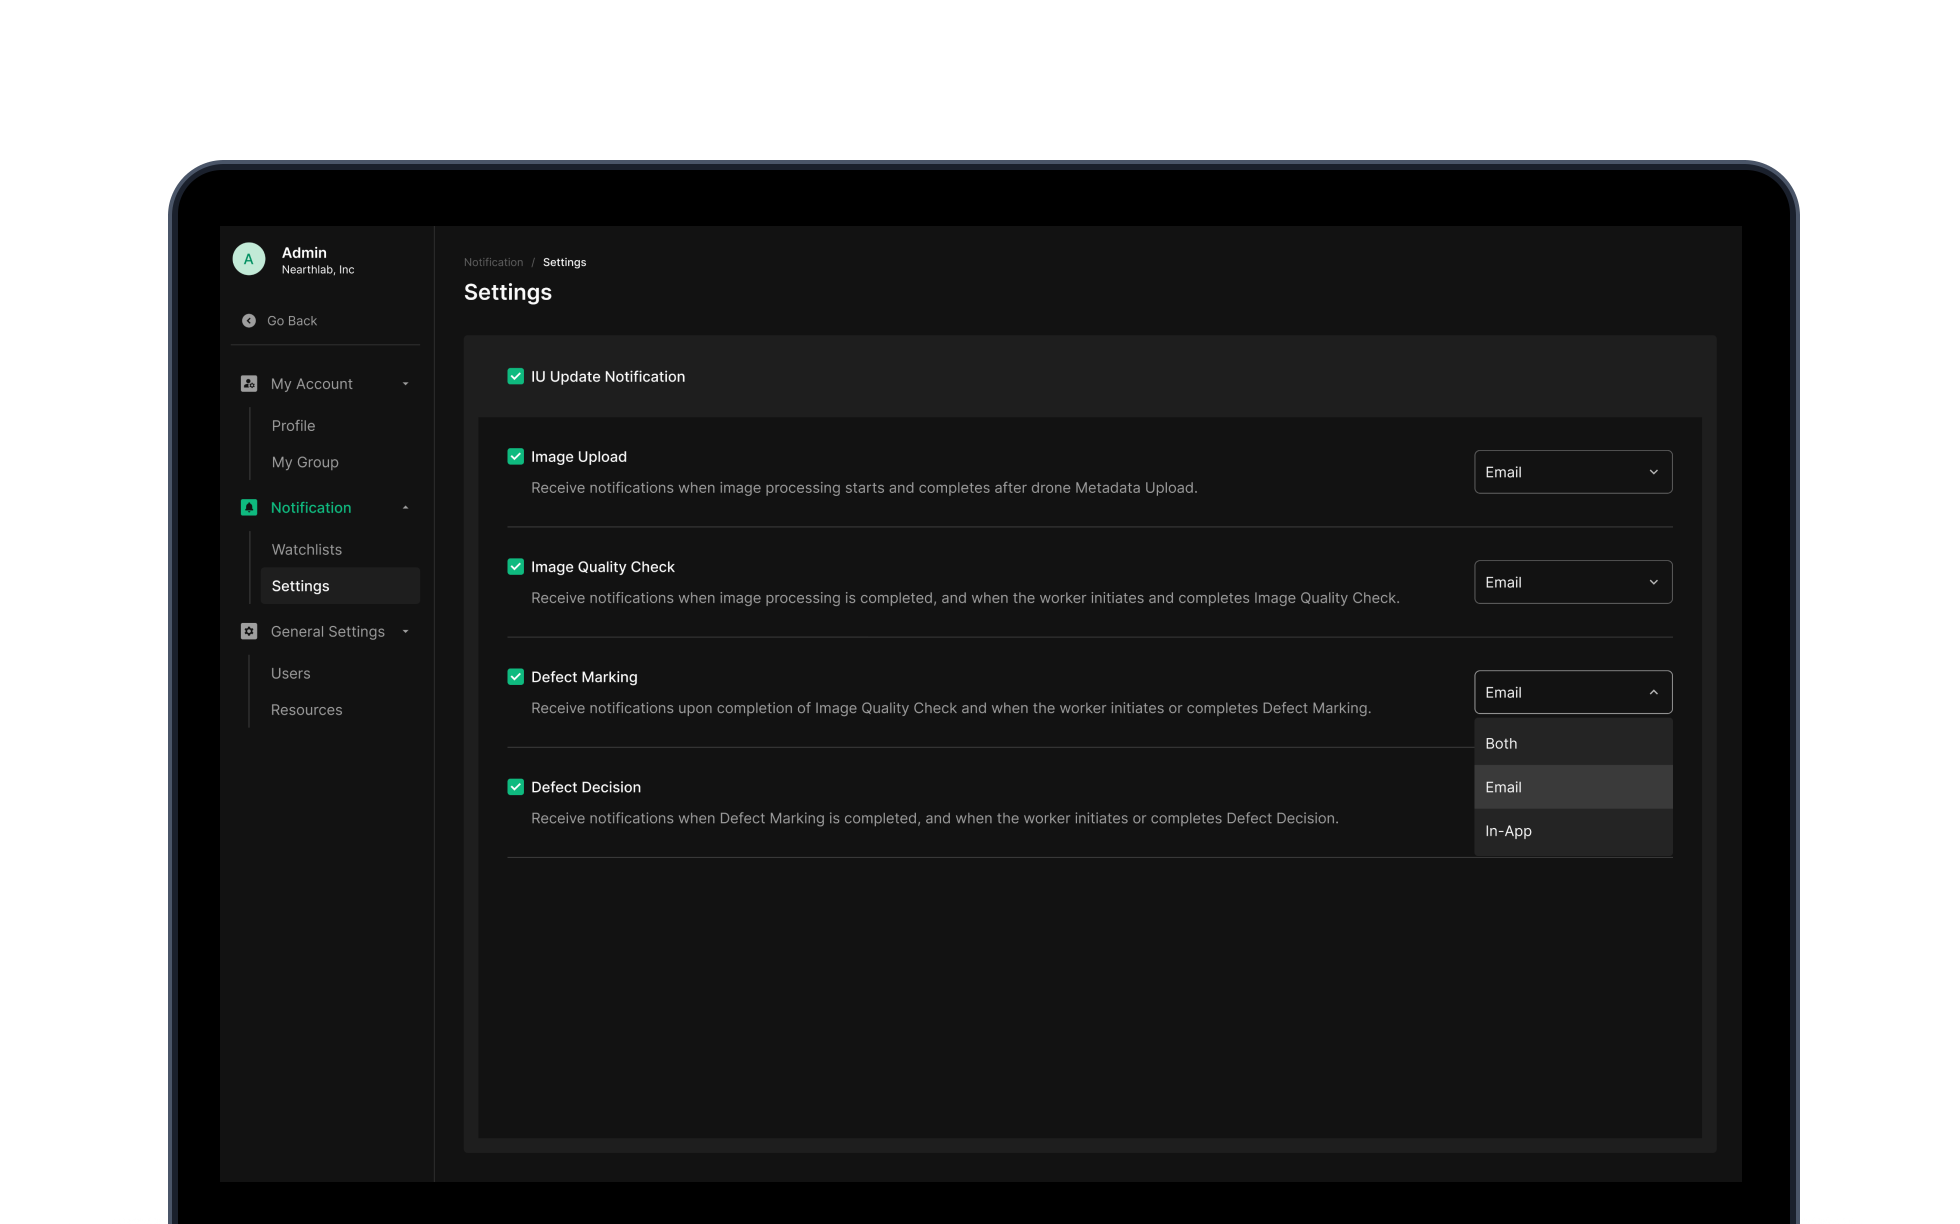
Personalized settings
My Account, Notification settings, and General Settings personalize per-user notifications and work management — tuned to each user's role and responsibility.
Core Feature 07
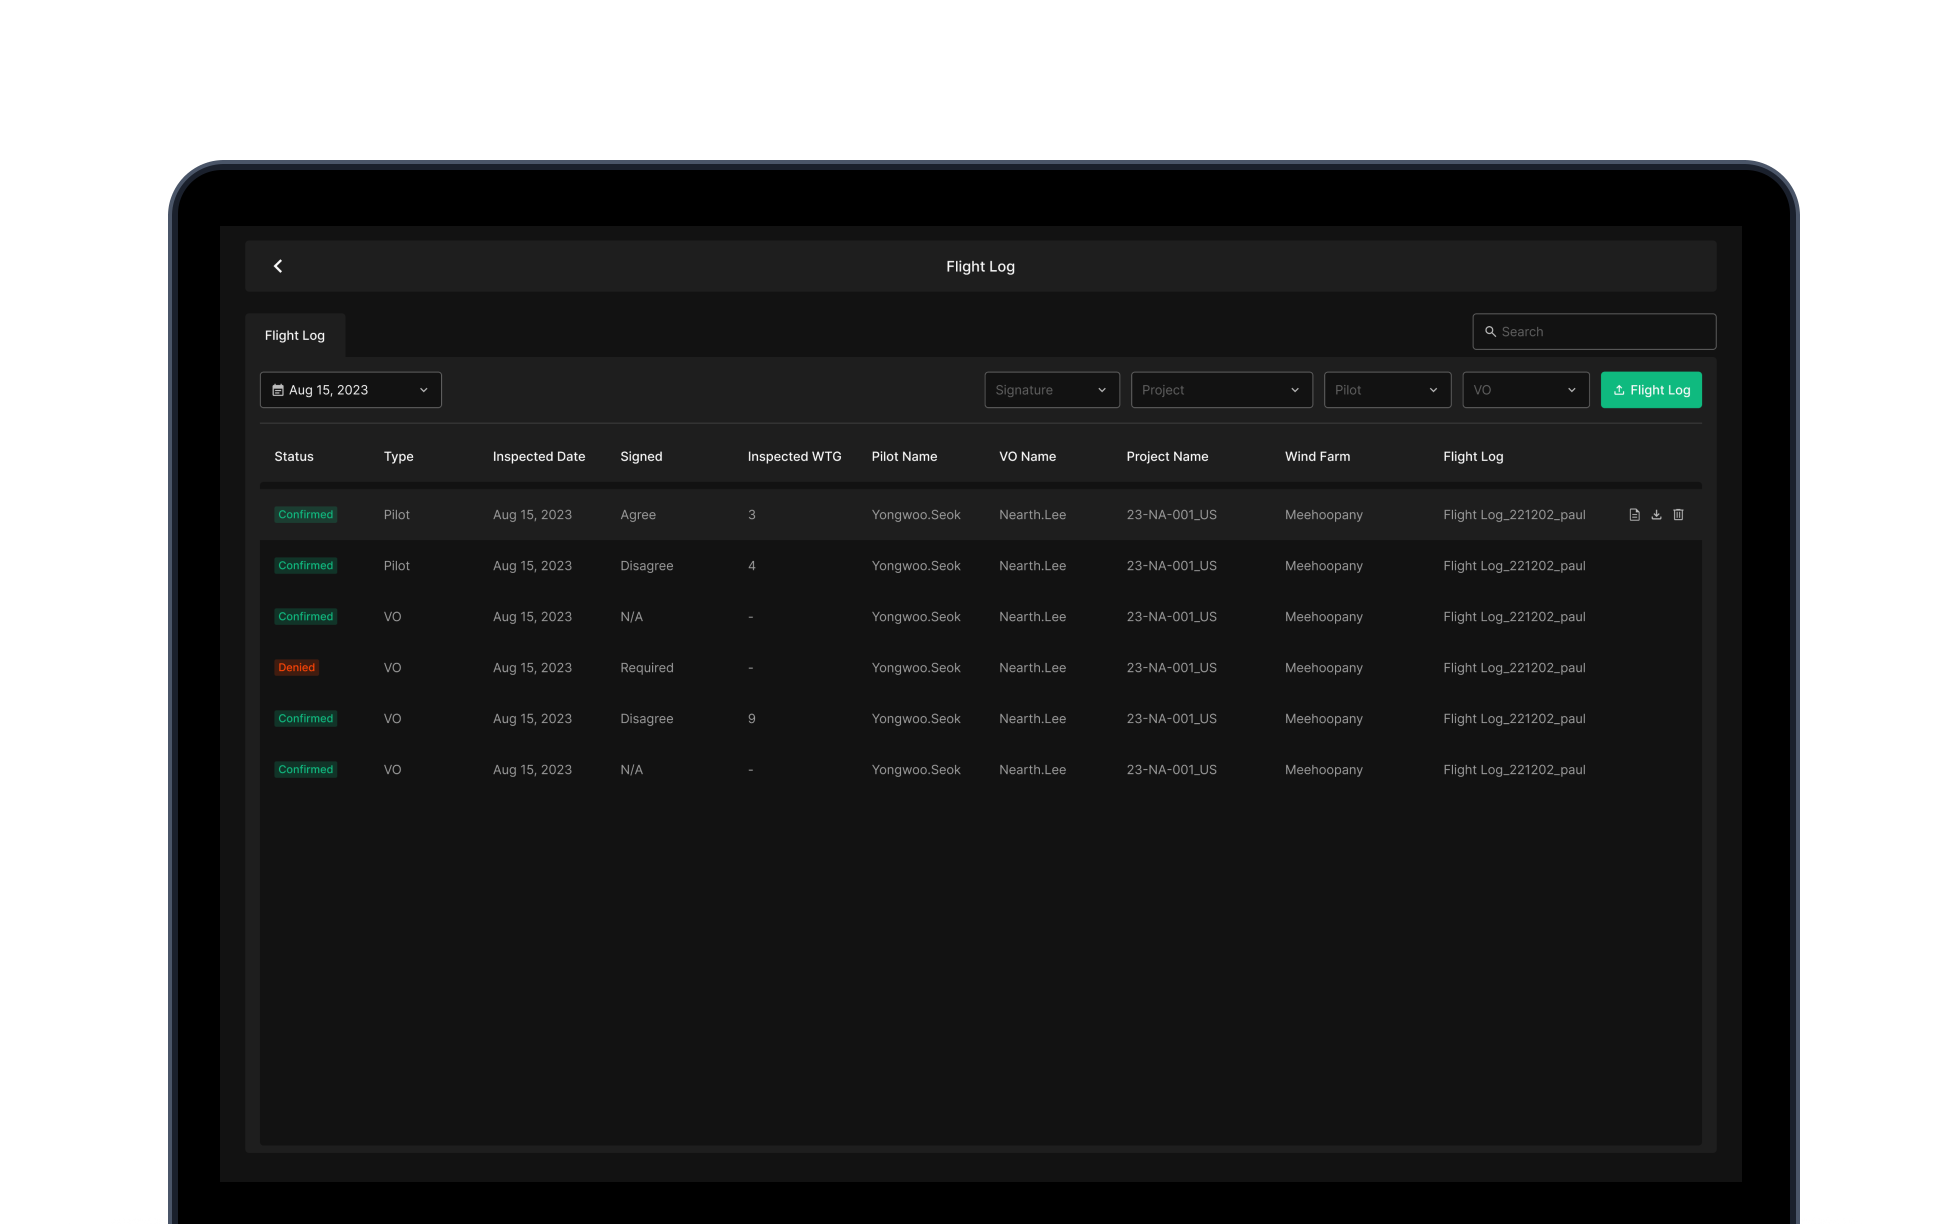
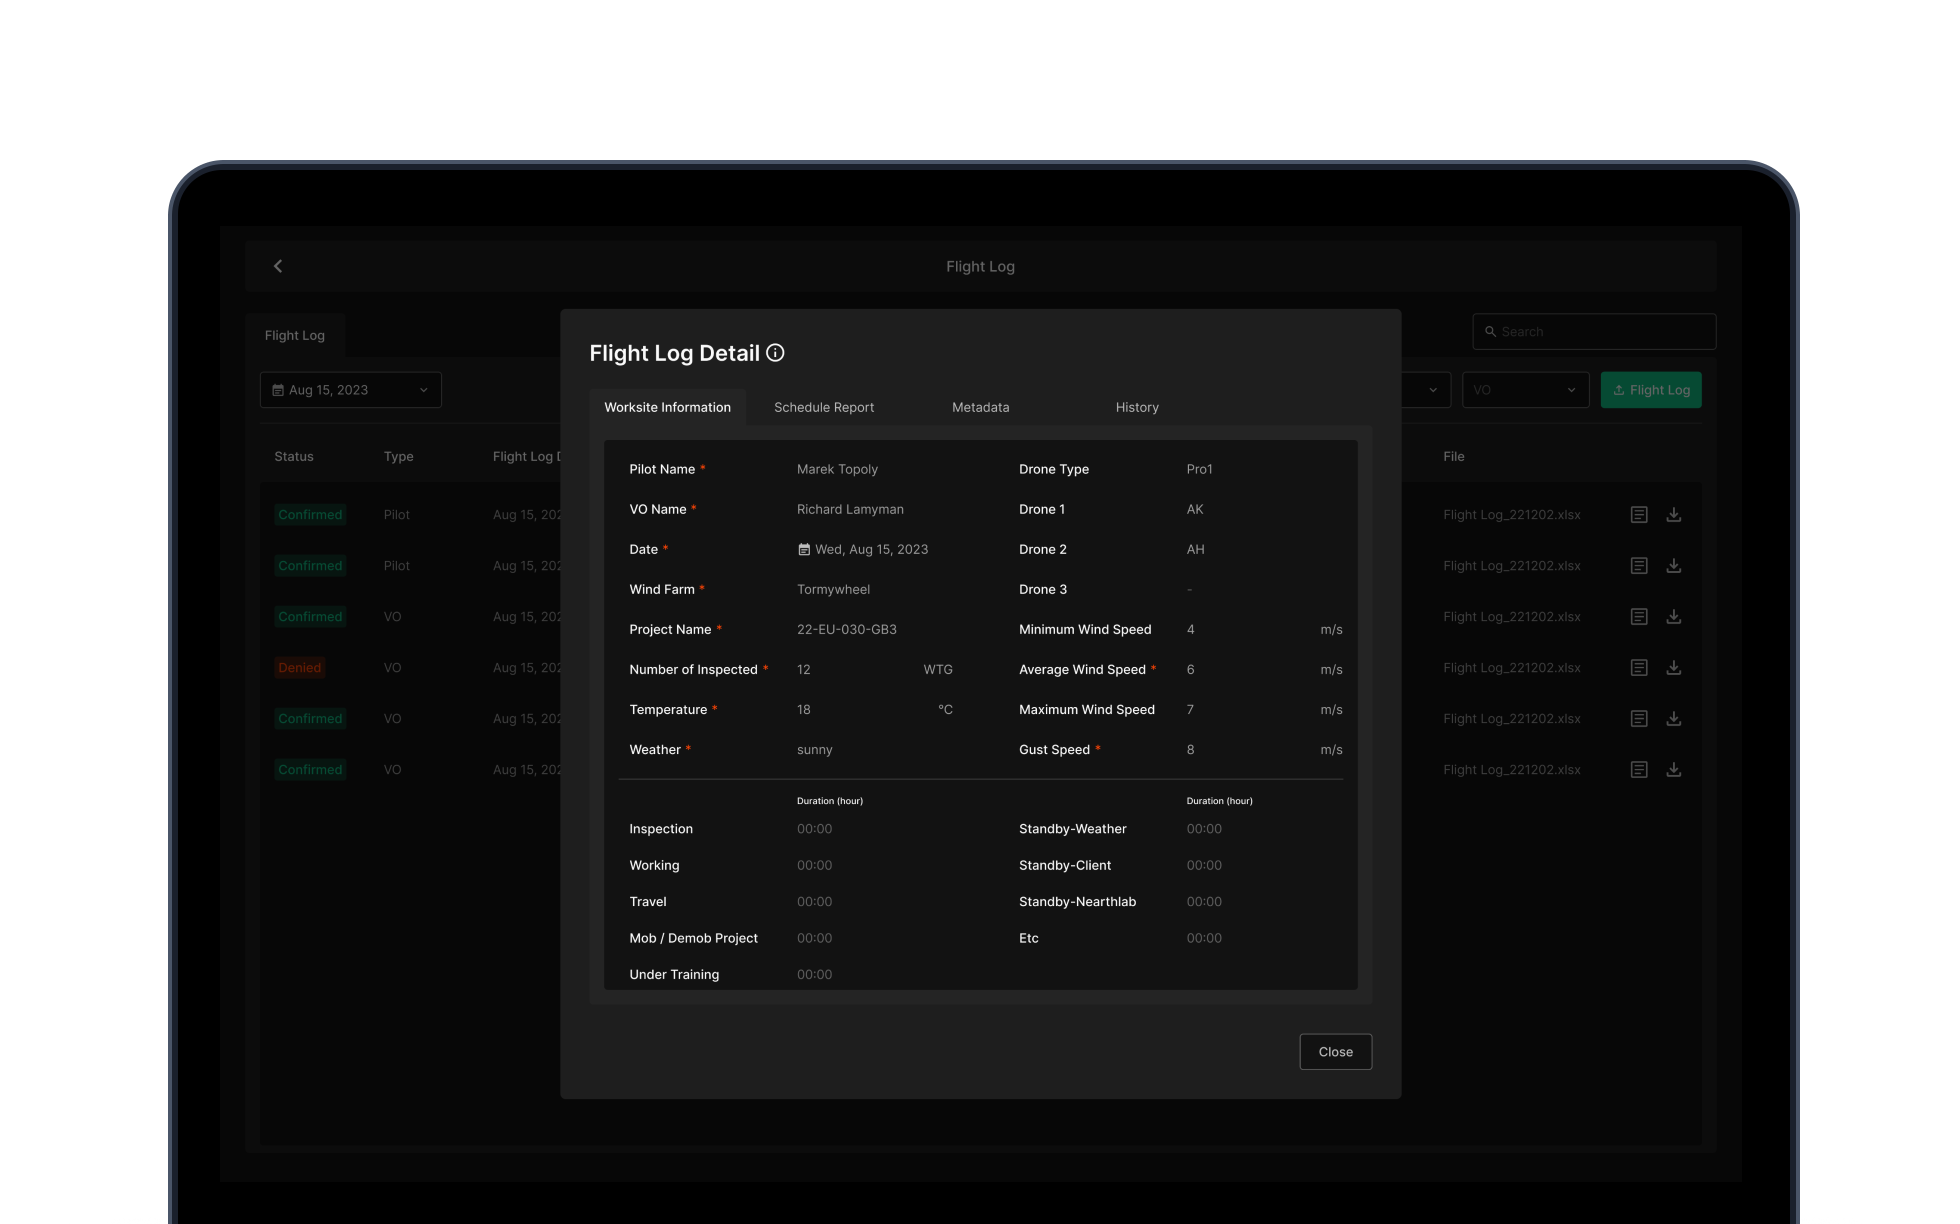
Flight Log
Not a record utility — the documentation and reconciliation layer of the inspection operation. Collect and process pilot flight logs, unify scattered data, and support automated post-processing. Accurate invoicing, professional customer response, and a workflow that gets better for pilots and operations together — all in one system.
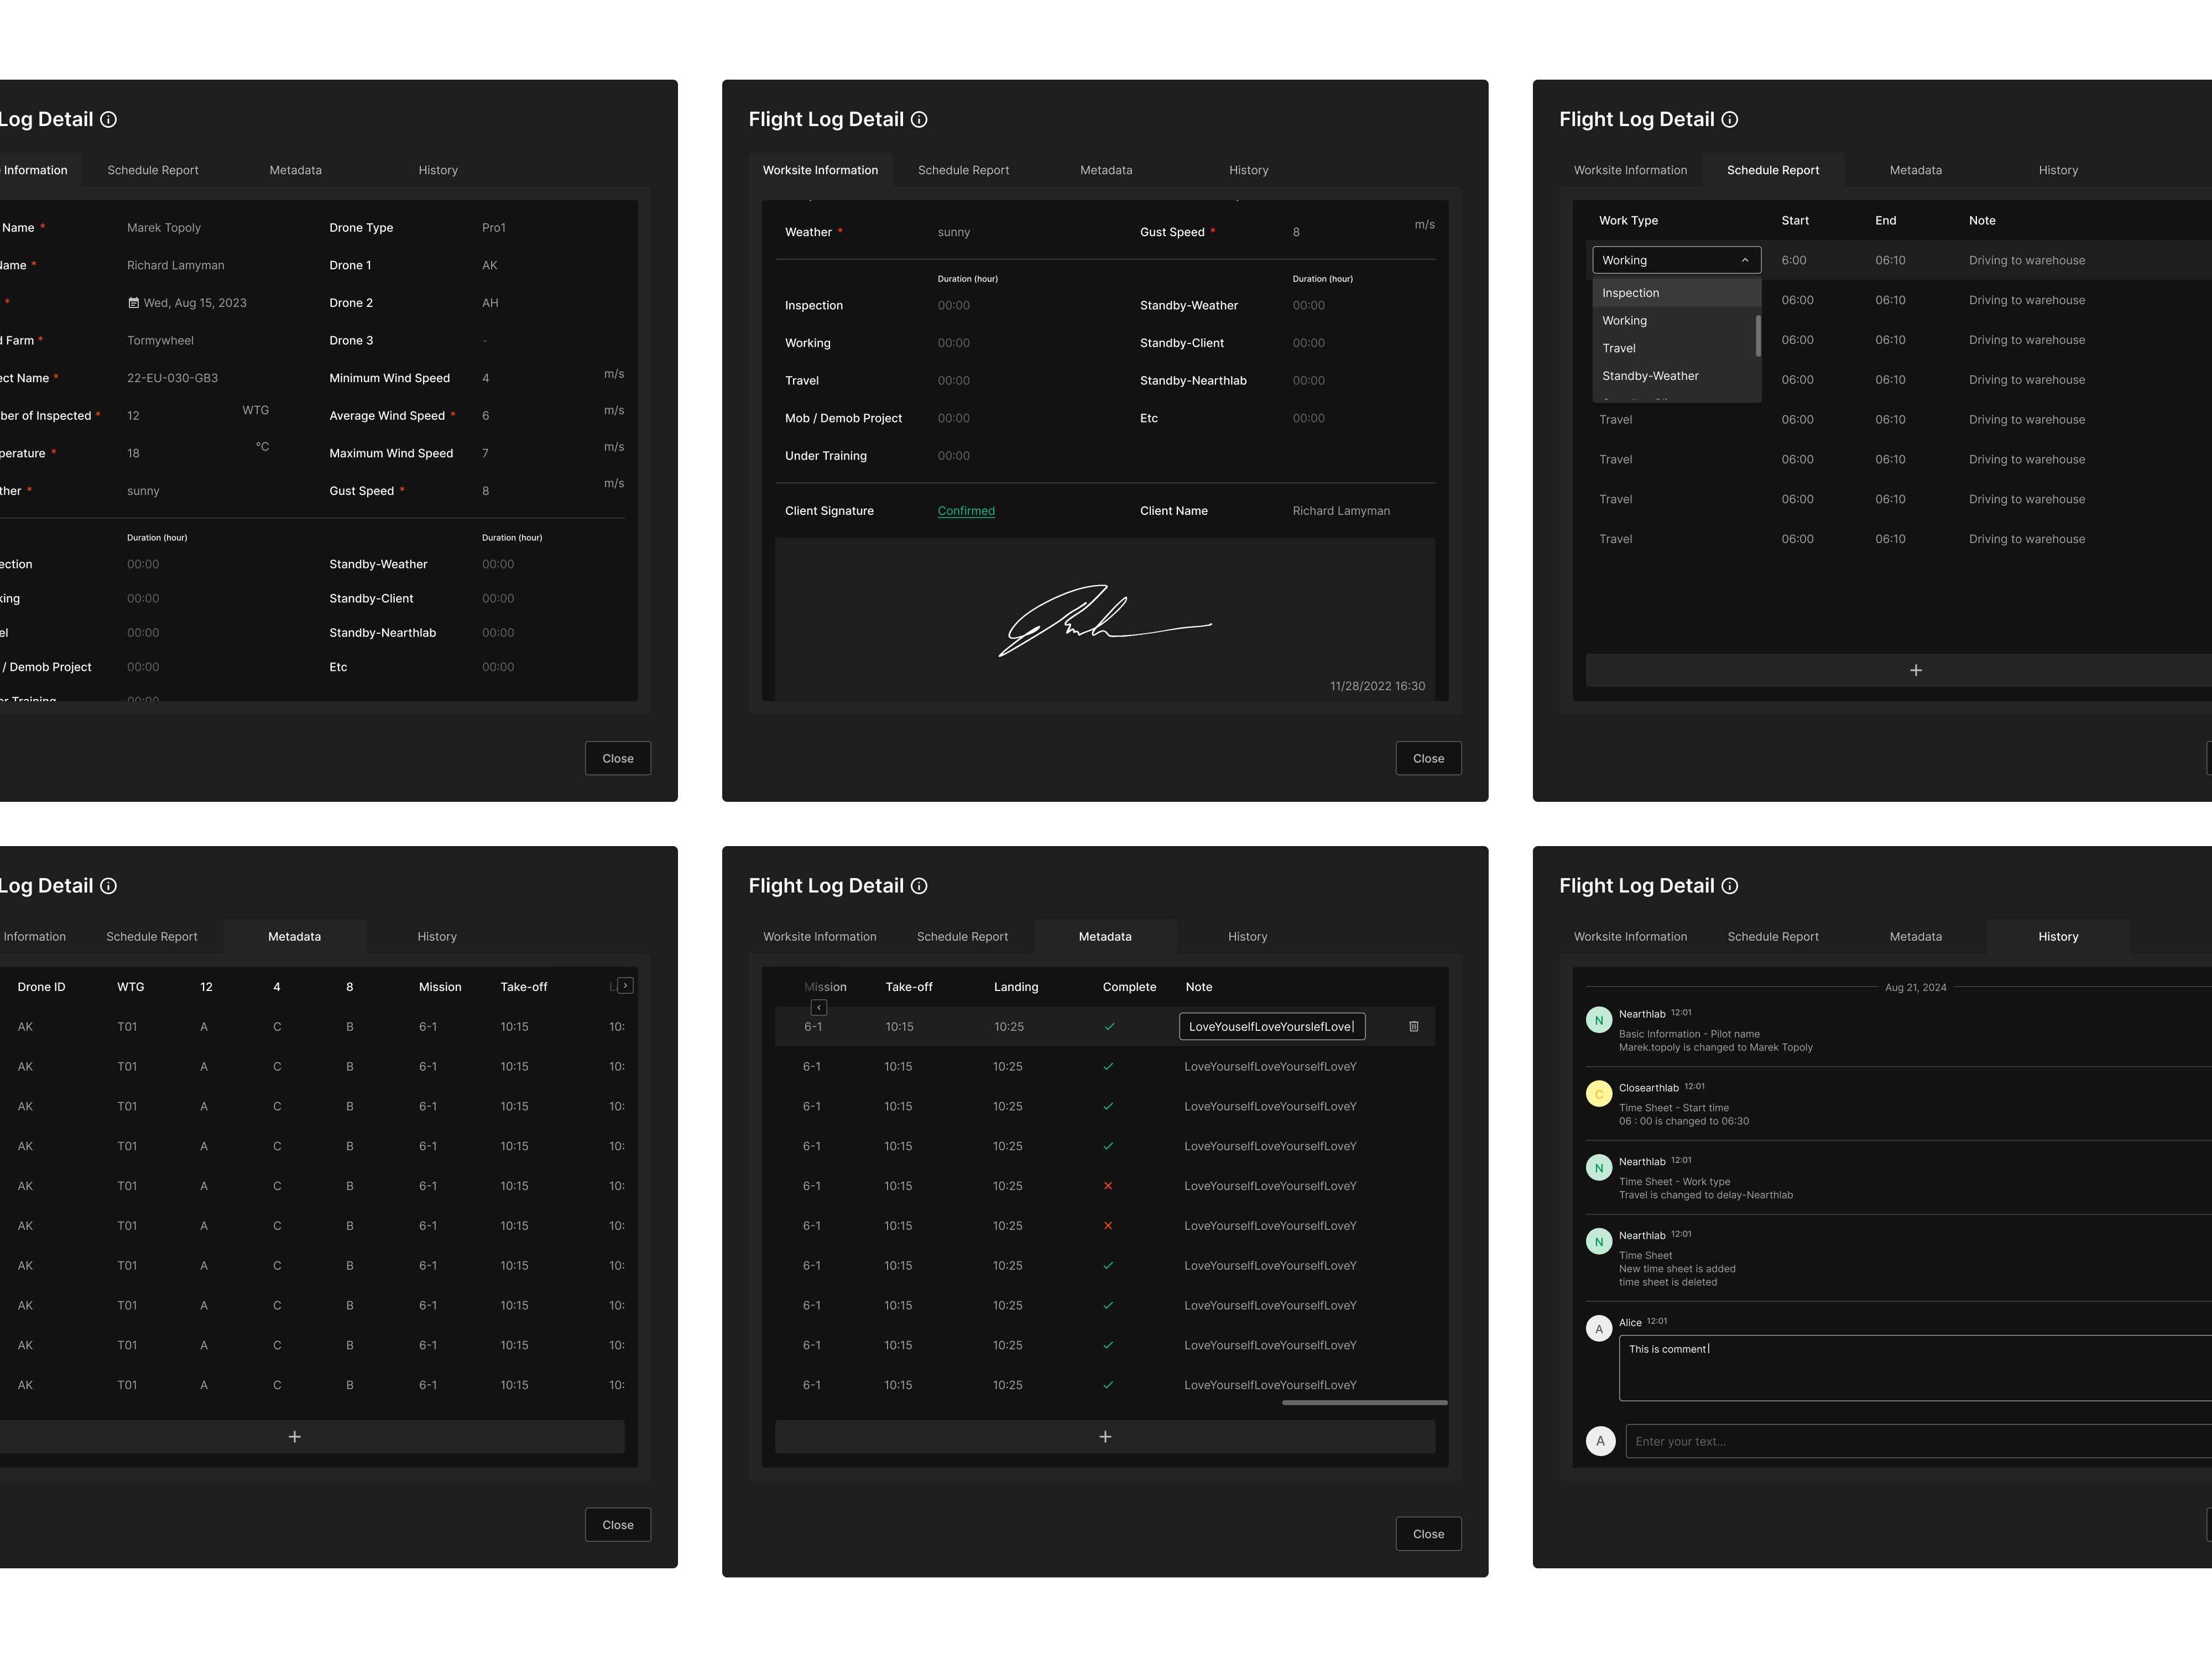
Data consolidation + status management
Date, uploader, work type, start/end time, signature, save time — every flight data point in one place. WEB/APP upload split and state checks preserve data integrity.
Metadata + workflow
Metadata upload, edit, and delete are supported. A Work Type description page locks in TPH values precisely. Pilot and operations workflows are streamlined through automated post-processing.
Invoicing + customer response
Download per-date flight logs as Excel or PDF to push invoice accuracy. Documentation supports a professional response to customer requests.
Design Decisions
The judgment calls that shaped the product
Why are Upload and Quality Check separate steps?
Upload is data collection. Quality check is data validation. In the field, the drone team usually uploads, and the inspection team verifies — splitting the steps respects role-specific workflow while keeping the quality gate explicit.
Why are OSD Viewer and Defect Marking separate steps?
OSD Viewer is the exploration tool — find defects on high-resolution imagery and validate AI detection. Defect Marking is the recording tool — convert findings into structured data. Splitting exploration from recording lets each step stay focused, and since marking integrity drives downstream decision and report trust, it needed its own quality envelope.
Why does Defect Decision need to be a separate step?
If marked defect data flows directly into repair instructions, false positives and over-calls turn into field cost. Splitting the final decision into its own step enables severity re-evaluation, blade/position-based filtering, and decision audit trails — it's the safety mechanism that prevents wrong repairs.
Why does Flight Log belong in the same product?
Flight logs are the operational record that proves the source and context of inspection imagery. Keep them in a separate system and invoice reconciliation, customer reporting, and audit lookups all require manual cross-checking. Inside the same platform, the data stays linked and the information cost between pilot, operations, and manager drops.
Outcome & Reflection
Project results
Total workflow time cut 60% vs. the manual baseline. Single-platform handling from upload to decision removes transition cost between steps.
Hybrid workflow of AI auto-detection plus human verification hits 95% accuracy. The quality gate guarantees input data quality.
Upload through Flight Log — seven modules covering the full inspection operation as one integrated workflow system.
Two years of feedback-driven iteration from pilots, inspectors, and managers — and stable operation throughout.
Reflection
Zoomable Worker was a project about designing a workflow where a complex industrial domain's many roles could collaborate naturally on one platform. Pilots own the flight log, inspectors handle marking and decisions, managers coordinate progress from the dashboard. Connecting the data flow and handoffs between those roles cleanly was the core challenge.
We started as an AI defect detection tool. As we understood the real field operation, the product scope expanded. Image quality decides analysis accuracy. Marking and decisions need to be separated. Flight log and inspection records need to connect for invoice accuracy. Every one of these came from field feedback.
Across two years we grew from a tool into an integrated system that transformed the whole inspection process. From this project I learned that in operational UX, workflow integrity matters more than feature convenience — and that in AI-assisted systems, how you design the human verification step decides whether the product gets trusted.